 |
 |
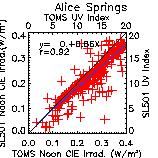 |
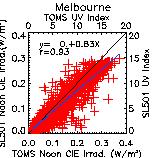
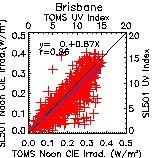
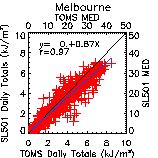
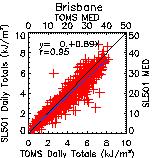
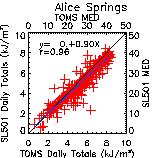
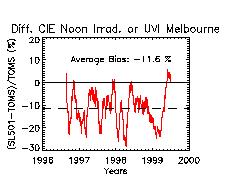
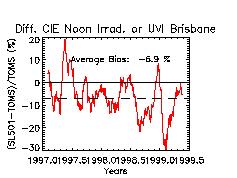
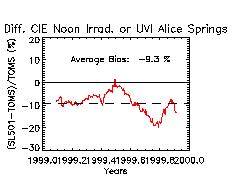
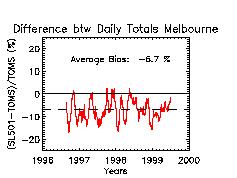
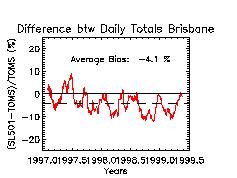
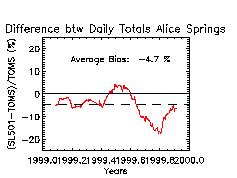
Figure 3: Comparisons between UVR measurements with a Solar Light 501 (SL501) biometer and TOMS derived surface UVR. Upper panels compare the UVR at noon and the lower panels show daily total erythemal exposures |
 |
 |
 |
Previous: Climatologies Next: Relationship between solar noon UVI and the daily erythemal exposures estimates Up: Ext. Abst.
Intercomparisons between SL501 UVR measurements and TOMS UVR estimates
The SL501 instrument at Melbourne has been calibrated by comparing it to measurements of selected clear sky days with a Spex 160B double monochromator spectroradiometer system, which in turn was calibrated against a 1000W tungsten halogen lamps traceable to the CSIRO National Measurement Laboratory. Furthermore, a cosine response function for two of the instruments have been determined. Assuming isotropic irradiance conditions the cosine correction factors are 1.04 for instrument #908 in Melbourne and 1.11 for the instrument #2031 in Brisbane. The instrument in Alice Springs has been corrected using the correction factor of the Brisbane biometer. Since their field deployment, the SL501 at Brisbane and Alice Springs have been calibrated vicariously with a radiative transfer model (Björn, 1989). The calibration method within the ARPANSA UVR network has been described in Gies et al., (1994) and the latest updates can be found in Roy et al. (1998). Herman et al. (1996) described the derivation of surface UV fluxes from TOMS. Intercomparisons between earlier data from the Australian UVR network and Nimbus-7 TOMS data between 1979-1992 have been discussed by Udelhofen et al., (1999).
For this study, colocated Earth Probe TOMS data from 07/1996-02/2000 were obtained from the NASA Goddard Space Flight Center (Celarier, personal communication). Results are shown in Figures 3 and 4 and summarized in Table 2. The results show a small negative bias between the SL501 and TOMS of 7-12\% at solar noon and 4-7\% for the daily total erythemal exposure (Figure 3). The standard deviations of the difference between SL501 and TOMS UVR range from 16 to 27\% at solar noon and vary between 13 and 19\% for the daily totals. A drift between the instruments was found in Brisbane (-3\%/year) and Alice Springs (-11\%/year), but the instrument at Melbourne showed no relative drift compared to TOMS. Generally, the SL501 measurements correlate well with TOMS, with correlation coefficients 0.86 and 0.97. The SL501 detectors are an improvement over the instruments used previously.
|
|
|
Figure 3: Comparisons between UVR measurements with a Solar Light 501 (SL501) biometer and TOMS derived surface UVR. Upper panels compare the UVR at noon and the lower panels show daily total erythemal exposures |
|
|
|
 |
 |
 |
 |
 |
 |
| Table 2: SL501/TOMS UVR Intercomparison | |||||||||||
|---|---|---|---|---|---|---|---|---|---|---|---|
| Station | # Data Points | Bias | Standard Deviation | Drift | Correlation | Regression fit | |||||
| Noon UVI | CIE Daily Totals | Noon UVI | CIE Daily Totals | Noon UVI | CIE Daily Totals | Noon UVI | CIE Daily Totals | Noon UVI | CIE Daily Totals | ||
| Melbourne | 1103 | -11.6% | -6.7% | 26.9% | 18.9% | 0.07%/yr | 0.49%/yr | 0.93 | 0.97 | 0.00+0.83TOMS | 0.11+0.87TOMS |
| Brisbane | 896 | -6.9% | -4.1% | 26.6% | 17.9% | -5.4%/yr | -3.0%/yr | 0.86 | 0.95 | 0.01+0.87TOMS | 0.15+0.95TOMS |
| Alice Springs | 360 | -9.3% | -4.7% | 15.8% | 13.2% | -8.15%/yr | -10.9%/yr | 0.92 | 0.96 | 0.01+0.86TOMS | 0.21+0.90TOMS |