| Table 1: Station Information | ||||||
|---|---|---|---|---|---|---|
| Station | Latitude | Longitude | Instrument | Data | Cos. Corr.Factor | |
| Melbourne | -37.48 | 144.58 | SL501 #908 | 1993-1999 | 1.04089 | |
| Brisbane | -27.25 | 153.07 | SL501 #2031 | 1997-1999 | 1.11127 | |
| Alice Springs | -13.42 | 133.53 | SL501 #1854 | 1999 | 1.11127* | |
Previous: Introduction Next: Intercomparisons between SL501 UVR measurements and TOMS UVR estimates Up: Ext. Abst.
Climatologies
Three stations were selected to represent the spatial variation of UVR in Australia (Figure 1).
|
|
|||||||||||||||||||||||||||||||||||
| Figure 1: Location of stations within the ARPANSA UVR network, Australia. Data used in this analysis are from stations highlighted in red. | ||||||||||||||||||||||||||||||||||||
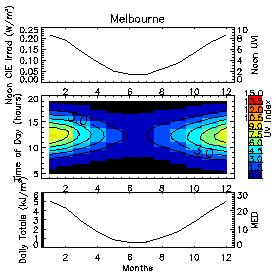
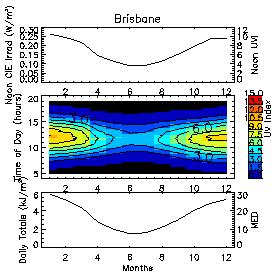
Melbourne is representative of midlatitudinal conditions, Brisbane the subtropical regime, and Alice Springs is located in the tropical desert of Australia. The UV Index (UVI, 1UVI=25mW/m2) at solar noon increases from the midlatitudes to the tropics (Figure 2). The monthly mean noon UVR at Melbourne is 4.8+/-2.7 on average based on measurements between 1993 and 1997. Interestingly, this corresponds to the minimum value at Alice Springs. In Brisbane the average UVI at noon is 7.0+/-2.6 based on data from 1997-1999, and in Alice Springs the average UVI at noon is 9.0+/-2.7 (data from 1999 only). The daily total erythemal exposures measured in units of Minimum Erythemal Dosage (MED, 1MED=200J/m2) vary between 13 and 23 when comparing Melbourne and Alice Springs. The average for Brisbane is 18 MED's.
 |
 |
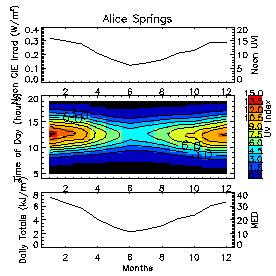 |
| Figure 2: Climatologies erythemal UVR measured with a Solar Light Biometer at Melbourne, Brisbane, and Alice Springs, Australia. The upper part of each diagram shows the time series at solar noon in units of W/m2 and in terms of the UV index. Bottom diagrams show the time series of daily exposures in kJ/m2 or in units of Minimum Erythemal Dosage (MED, 1MED=200J/m2). | ||