| Table 1: Station Information | ||||||
|---|---|---|---|---|---|---|
| Station | Latitude | Longitude | Instrument | Data | Cos. Corr.Factor | |
| Melbourne | -37.48 | 144.58 | SL501 #908 | 1993-1999 | 1.04089 | |
| Brisbane | -27.25 | 153.07 | SL501 #2031 | 1997-1999 | 1.11127 | |
| Alice Springs | -13.42 | 133.53 | SL501 #1854 | 1999 | 1.11127* | |
*Institute for Terrestrial and Planetary Atmospheres, State University
of New York, Stony Brook, New York, U.S.A.
#ARPANSA, Yallambie, Victoria 3085, Australia
FIGURES
Abstract
Introduction
Ultraviolet radiation (UVR) has a profound impact on erythema, skin cancer, and plant damage. Over the northern parts of Australia, incidences of skin cancer rank amongst the highest in the world. The maximum UVR at solar noon, often expressed as UV Index (UVI, ICNIRP-1/95, 1995), is useful as an indicator of the maximum potential UVR hazard. The Australian Radiation and Nuclear Safety Agency (ARPANSA) has run a network of broadband UV instruments since the middle of the 1980's. The network initially employed International Light (IL) actinic detectors. Since 1992/1993 Solar Light 501 UVBiometers have been in use in all major capitals taking measurements routinely every 10 mins. Here, we will present the ambient UVR in selected cities of Australia from SL501 biometers and compare those to surface UVR derived from TOMS both for local noon and total daily exposures. We will show that the TOMS data are very useful for validating surface data. The surface data on the other hand provide a higher temporal resolution.
Climatologies
Three stations were selected to represent the spatial variation of UVR in Australia (Figure 1).
|
|
|||||||||||||||||||||||||||||||||||
| Figure 1: Location of stations within the ARPANSA UVR network, Australia. Data used in this analysis are from stations highlighted in red. | ||||||||||||||||||||||||||||||||||||
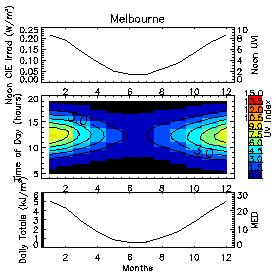
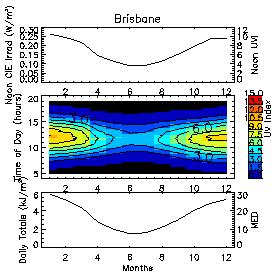
Melbourne is representative of midlatitudinal conditions, Brisbane the subtropical regime, and Alice Springs is located in the tropical desert of Australia. The UV Index (UVI, 1UVI=25mW/m2) at solar noon increases from the midlatitudes to the tropics (Figure 2). The monthly mean noon UVR at Melbourne is 4.8+/-2.7 on average based on measurements between 1993 and 1997. Interestingly, this corresponds to the minimum value at Alice Springs. In Brisbane the average UVI at noon is 7.0+/-2.6 based on data from 1997-1999, and in Alice Springs the average UVI at noon is 9.0+/-2.7 (data from 1999 only). The daily total erythemal exposures measured in units of Minimum Erythemal Dosage (MED, 1MED=200J/m2) vary between 13 and 23 when comparing Melbourne and Alice Springs. The average for Brisbane is 18 MED's.
 |
 |
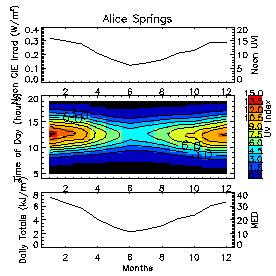 |
| Figure 2: Climatologies erythemal UVR measured with a Solar Light Biometer at Melbourne, Brisbane, and Alice Springs, Australia. The upper part of each diagram shows the time series at solar noon in units of W/m2 and in terms of the UV index. Bottom diagrams show the time series of daily exposures in kJ/m2 or in units of Minimum Erythemal Dosage (MED, 1MED=200J/m2). | ||
Intercomparisons between SL501 UVR measurements and TOMS UVR estimates
The SL501 instrument at Melbourne has been calibrated by comparing it to measurements of selected clear sky days with a Spex 160B double monochromator spectroradiometer system, which in turn was calibrated against a 1000W tungsten halogen lamps traceable to the CSIRO National Measurement Laboratory. Furthermore, a cosine response function for two of the instruments have been determined. Assuming isotropic irradiance conditions the cosine correction factors are 1.04 for instrument #908 in Melbourne and 1.11 for the instrument #2031 in Brisbane. The instrument in Alice Springs has been corrected using the correction factor of the Brisbane biometer. Since their field deployment, the SL501 at Brisbane and Alice Springs have been calibrated vicariously with a radiative transfer model (Björn, 1989). The calibration method within the ARPANSA UVR network has been described in Gies et al., (1994) and the latest updates can be found in Roy et al. (1998). Herman et al. (1996) described the derivation of surface UV fluxes from TOMS. Intercomparisons between earlier data from the Australian UVR network and Nimbus-7 TOMS data between 1979-1992 have been discussed by Udelhofen et al., (1999).
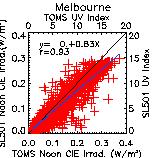
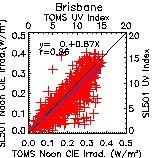
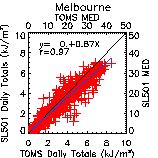
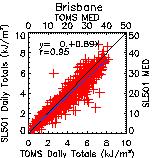
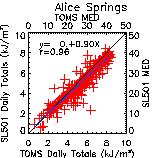
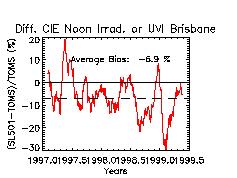
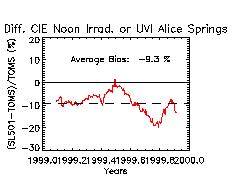
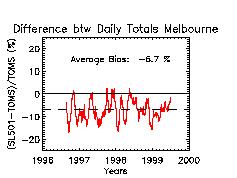
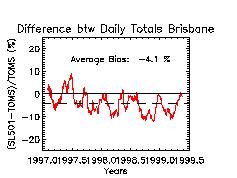
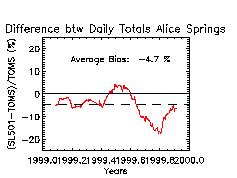
For this study, colocated Earth Probe TOMS data from 07/1996-02/2000 were obtained from the NASA Goddard Space Flight Center (Celarier, personal communication). Results are shown in Figures 3 and 4 and summarized in Table 2. The results show a small negative bias between the SL501 and TOMS of 7-12\% at solar noon and 4-7\% for the daily total erythemal exposure (Figure 3). The standard deviations of the difference between SL501 and TOMS UVR range from 16 to 27\% at solar noon and vary between 13 and 19\% for the daily totals. A drift between the instruments was found in Brisbane (-3\%/year) and Alice Springs (-11\%/year), but the instrument at Melbourne showed no relative drift compared to TOMS. Generally, the SL501 measurements correlate well with TOMS, with correlation coefficients 0.86 and 0.97. The SL501 detectors are an improvement over the instruments used previously.
 |
 |
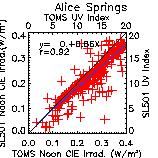 |
Figure 3: Comparisons between UVR measurements with a Solar Light 501 (SL501) biometer and TOMS derived surface UVR. Upper panels compare the UVR at noon and the lower panels show daily total erythemal exposures |
 |
 |
 |
 |
 |
 |
 |
 |
 |
| Table 2: SL501/TOMS UVR Intercomparison | |||||||||||
|---|---|---|---|---|---|---|---|---|---|---|---|
| Station | # Data Points | Bias | Standard Deviation | Drift | Correlation | Regression fit | |||||
| Noon UVI | CIE Daily Totals | Noon UVI | CIE Daily Totals | Noon UVI | CIE Daily Totals | Noon UVI | CIE Daily Totals | Noon UVI | CIE Daily Totals | ||
| Melbourne | 1103 | -11.6% | -6.7% | 26.9% | 18.9% | 0.07%/yr | 0.49%/yr | 0.93 | 0.97 | 0.00+0.83TOMS | 0.11+0.87TOMS |
| Brisbane | 896 | -6.9% | -4.1% | 26.6% | 17.9% | -5.4%/yr | -3.0%/yr | 0.86 | 0.95 | 0.01+0.87TOMS | 0.15+0.95TOMS |
| Alice Springs | 360 | -9.3% | -4.7% | 15.8% | 13.2% | -8.15%/yr | -10.9%/yr | 0.92 | 0.96 | 0.01+0.86TOMS | 0.21+0.90TOMS |
Relationship between solar noon UVI and the daily erythemal exposures
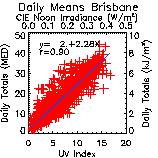
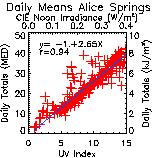
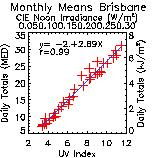
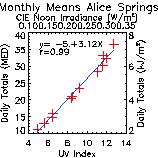
Daily or yearly total exposures are better measures of the overall levels of the ambient UVR, because they take into account the cloud cover variability. For example, measurements at solar noon on two consecutive days in March in Melbourne resulted in similar noon dose rates of 0.23 and 0.21 W/m2 (or 9.1 and 8.5 UVI's), but the daily total dosage was reduced by 47% from 4880 to 2160 J/m2 due to cloudiness (Gies et al., 1999). To investigate the relationship between the solar noon UVI and the daily total erythemal exposure further, we performed a linear regression analysis (Figure 5). It was found the the daily total exposures can be expressed as a function of solar noon UVI. Regressions of daily averaged data revealed a slope of 2.3-2.6 MED/UVI, with large standard deviations of the difference between fitted and original data of 15-31\%. Alice Springs data show the least variation, probably because the skies are clear for more than 90% of the year.
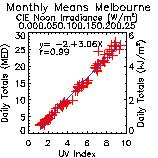
On a monthly mean scale the relationship improves considerably at all stations. A regression coefficient of 3.0+/-0.1MED/UVI has been found independent of the site. The standard deviations of the difference between fitted and original data was less than 10%. As the relation did not change much from one station to another, this simple approximation might prove useful for monitoring the ambient UVR.
| Figure 5: Relationship between daily erythemal exposures and UV Index at noon for three stations in Australia. The results indicate that on a monthly mean time scale, the daily total erythemal exposures can be estimated from a single measurement at solar noon. However, none of these stations show a pronounced diurnal cycle in cloud cover. Future studies will investigate whether this relation holds at stations with a strong diurnal cycle of convection. | 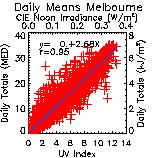 |
 |
 |
 |
 |
 |
Interannual variability
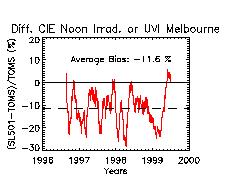
Monthly mean anomalies of UVR variations for at Melbourne are shown in Figure 6 for the time period between 1993-1999. At any time of the day variations in UVR were less than 1 UVI. Daily total erythemal exposures vary between +/- 2 MED. Changes in noontime UVR are generally translate into variations in daily exposures. The correlation between noontime UVI and daily totals is 0.79. Anomalies did not reveal any significant trends, but random fluctuation with a standard deviation of 8.6% for the UVR at solar noon and 6.6% for the daily totals.
| Figure 6: Anomalies in UVR as a function of month and time of day, derived from SL501 measurements for Melbourne. The upper panel shows the UVR at solar noon, the bottom panel the daily total erythemal exposure. The changes in UVR appear to be small, and noon UVR anomalies are correlated well with anomalies of daily total exposure; the correlation coefficient is 0.79. The standard deviation of the anomalies is 8.6% at solar noon and 6.6 % for the daily total exposure. Results of a linear regression revealed no significant trends. | 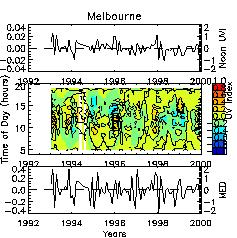 |
Conclusions
Climatologies of UVR have been derived for three stations in Australia. It was found the the daily total erythemal exposures can be expressed in terms of the UV Index as solar noon if the diurnal variability of cloud cover is random. On a monthly averaged scale, estimations of daily total UVR exposures can be obtained with standard deviations of less than 10% independent of location. In Melbourne, the interannual variability in UV irradiances is generally less than 1 UVI at all hours of the days, so that the interannual variations of daily total erythemal exposures are +/- 2MED.
TOMS UVR overpass data have proven very valuable for the validation of UVR measurements from surface instruments, because they provide an independent estimation of UVR under all sky conditions. This is particularly useful for the evaluation of surface UVR measurements at remote sites. The surface data on the other hand provide a higher temporal resolution, so that a combination of TOMS and surface data complement each other and provide a comprehensive monitoring tool for the environmental UVR. Access to regularly updated TOMS UVR overpass data would be very useful for the operations of surface UVR networks.
Acknowledgements
We would like to thank the NASA/Goddard Space Flight Center for providing the TOMS UV overpass data. Special thanks go to Edward Celarier from the Software Corporation of America for his support.
References
Björn, L. O., Computer programs for estimating ultraviolet radiation in daylight, in Radiation Measurement in Photobiology , edited by B. L. Diffey, pp. 162--189, Academic, San Diego, Calif., 1989.
Gies, H. P., C. R. Roy, S. Toomey, and D. Tomlinson, The ARL solar UVR measurement network: Calibration and results, in Ultraviolet Technology V, vol. 2282, pp. 274-284, SPIE-The International Society for Optical Engineering, 1994.
Gies, P., C. Roy, S. Toomey, and D. Tomlinson, Ambient solar UVR, personal exposure and protection, Journal of Epidemiology, 9, S-115-S-122, 1999.
Herman, J. R., P. K. Bhartia, J. Ziemke, Z. Ahmad, and D. Larko, UV-B increases 1979-1992 from decreases in total ozone, Geophys. Res. Lett., 23, 2117-2120, 1996.
ICNIRP-1/95, International Commission on Non-Ionizing Radiation Protection, Global Solar UV Index. International Commission on Non-Ionizing Radiation Protection. 1995.
Roy, C., H. P. Gies, D. J. Lugg, S. Toomey, and D. W. Tomlinson, The measurements of solar ultraviolet radiation, Mutation Research , pp. 7-14, 1998.
Udelhofen, P. M., H. P. Gies, C. R. Roy, and W. J. Randel, Surface UV radiation over Australia, 1979-1992: The effect of ozone and cloud cover changes on variations of UV radiation, J. Geophys. Res., 104, 19,135-19,159, 1999.
Back to
| Session 1 : Stratospheric Processes and their Role in Climate | Session 2 : Stratospheric Indicators of Climate Change |
| Session 3 : Modelling and Diagnosis of Stratospheric Effects on Climate | Session 4 : UV Observations and Modelling |
| AuthorData | |
| Home Page | |