Previous: Interannual variability Next: Acknowledegments Up: Ext. Abst.
Interannual variability
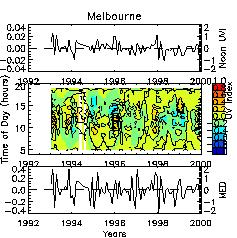
Monthly mean anomalies of UVR variations for at Melbourne are
shown in Figure 6 for the time period between 1993-1999. At any
time of the day variations in UVR were less than 1 UVI. Daily
total erythemal exposures vary between +/- 2 MED. Changes in noontime
UVR are generally translate into variations in daily exposures.
The correlation between noontime UVI and daily totals is 0.79.
Anomalies did not reveal any significant trends, but random fluctuation
with a standard deviation of 8.6% for the UVR at solar noon and
6.6% for the daily totals.
| Figure 6: Anomalies in UVR as a function of month and time of day, derived
from SL501 measurements for Melbourne. The upper panel shows the
UVR at solar noon, the bottom panel the daily total erythemal
exposure. The changes in UVR appear to be small, and noon UVR
anomalies are correlated well with anomalies of daily total exposure;
the correlation coefficient is 0.79. The standard deviation of
the anomalies is 8.6% at solar noon and 6.6 % for the daily total
exposure. Results of a linear regression revealed no significant
trends. |
 |
Previous: Interannual variability Next: Acknowledegments Up: Ext. Abst.