Previous: Intercomparisons between SL501 UVR measurements and TOMS UVR estimates Next: Interannual variability Up: Ext. Abst.
Relationship between solar noon UVI and the daily erythemal exposures
Daily or yearly total exposures are better measures of the overall
levels of the ambient UVR, because they take into account the
cloud cover variability. For example, measurements at solar noon
on two consecutive days in March in Melbourne resulted in similar
noon dose rates of 0.23 and 0.21 W/m2 (or 9.1 and 8.5 UVI's), but the daily total dosage was reduced
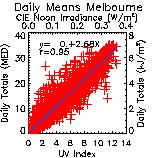
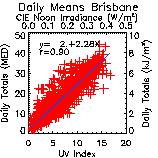
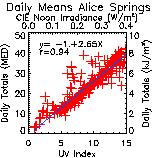
by 47% from 4880 to 2160 J/m2 due to cloudiness (Gies et al., 1999). To investigate the relationship between the solar noon
UVI and the daily total erythemal exposure further, we performed
a linear regression analysis (Figure 5). It was found the the
daily total exposures can be expressed as a function of solar
noon UVI. Regressions of daily averaged data revealed a slope
of 2.3-2.6 MED/UVI, with large standard deviations of the difference
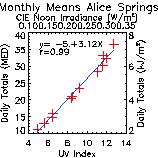
between fitted and original data of 15-31\%. Alice Springs data
show the least variation, probably because the skies are clear
for more than 90% of the year.
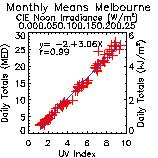
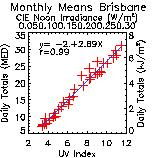
On a monthly mean scale the relationship improves considerably
at all stations. A regression coefficient of 3.0+/-0.1MED/UVI
has been found independent of the site. The standard deviations
of the difference between fitted and original data was less than
10%. As the relation did not change much from one station to another,
this simple approximation might prove useful for monitoring the
ambient UVR.
| Figure 5: Relationship between daily erythemal exposures and UV Index at
noon for three stations in Australia. The results indicate that
on a monthly mean time scale, the daily total erythemal exposures
can be estimated from a single measurement at solar noon. However,
none of these stations show a pronounced diurnal cycle in cloud
cover. Future studies will investigate whether this relation holds
at stations with a strong diurnal cycle of convection. |
 |
 |
 |
|
 |
 |
 |
Previous: Intercomparisons between SL501 UVR measurements and TOMS UVR estimates Next: Interannual variability Up: Ext. Abst.