(1) Climate Research Group, Department of Atmospheric Sciences, University
of Illinois at Urbana-Champaign, 105 S. Gregory Street, Urbana,
IL 61801, USA
(2) EMC/NCEP, 5200 Auth Road, Camp Springs, MD 20746, USA
(3) Main Geophysical Observatory, 7 Karbyshev Street, 124021, S. Petersburg,
Russia
FIGURES
Abstract
1. Introduction
The products of a major explosive volcanic eruption produce significant changes in the radiation fields in the stratosphere, thereby affecting the stratospheric heating and photolysis rates, and the stratospheric temperature and circulation patterns. Additionally, the sulfate aerosol produced in situ from the oxidation of sulfate-containing gases provides the medium for relatively fast heterogeneous chemical reactions that transfer active nitrogen oxides to the more passive nitrous acid form, which leads to changes in the ozone concentration. The ozone changes, in turn, can affect the radiation, temperature and dynamics in the middle and lower stratosphere. Therefore, a theoretical and observational study of the post-volcanic changes can substantially improve our understanding of the different physical and chemical processes in the atmosphere and their relationships. Studies of the consequences of volcanic eruptions can facilitate understanding of how the climate system responds to the stratospheric perturbation and enable estimation of the magnitude of the possible influence of stratospheric processes on the tropospheric climate/weather system. Modelling efforts and comparison of the simulated changes in post-volcanic periods will also allow determination of how successfully the actual processes in the atmosphere can be simulated by a model, and what part of a model should be improved to obtain better performance.
Among the major volcanic eruptions (e.g., McCormic et al. [1995]; Rampino and Self[1984]; Robock and Mao [1995]), Pinatubo is an exception owing to the numerous observations collected during and after its eruption in June, 1991. The formation and evolution of the aerosol cloud, optical properties of the aerosol, radiative fluxes, chemical composition, temperature and the dynamical state of the atmosphere have been observed by a variety of satellite, balloon, lidar, airborne and ground-based instruments.
The availability of different satellite measurements has allowed development of a dataset of aerosol optical properties (Stenchikov et al. [1998]; Andronova et al. [1999]) which can be used in the simulation of the radiative and climatic effects of the Pinatubo aerosol. However, from analyses of the observations alone it is difficult to understand which processes are responsible for the observed changes of ozone and temperature following the Pinatubo eruption. Ozone, temperature and dynamics are closely linked in the real atmosphere. Therefore, only model simulations of the consequences of the Mount Pinatubo eruption with state-of-the-art models, sensitivity studies therewith, and comparison of their results with the observations can answer the question: Which processes are mainly responsible for the observed ozone and temperature changes?
During the last 7 years a number of modeling studies of the effects of the Pinatubo eruption have been performed, mainly with 2-D zonally averaged stratospheric models. These modeling efforts mainly addressed the causes of the ozone changes and the potential role of heterogeneous processes in the observed ozone depletion. The results obtained by Brasseur and Granier [1992], Pitari and Rizi [1993], Kinnison et al. [1994], Tie et al. [1994], Jackman et al. [1996] and Solomon et al. [1996] proved that heterogeneous chemistry is the most important factor for the simulated ozone depletion in the tropics and polar areas. However, in the paper by Rosenfield et al. [1997] it was found that the main process responsible for 60% of the ozone depletion in the tropics is the increased upward motion resulting from the enhanced heating rates. In this model, heterogeneous chemistry determines only about 20% of the total ozone decrease in the tropics. This was explained as being due to the use in this simulation of a new, highly interactive 2-D model, with a parameterized description of planetary waves and a direct calculation of the eddy mixing. This shows how significant it is to include in the model, interactively, all the relevant processes. However, some inherent limitations of 2-D models hamper their ability to simulate interactively the many chemical, hydro-thermodynamical, radiative and hydrological processes that are involved in determining the influence of the Pinatubo aerosol on the atmosphere. A more appropriate tool for such studies is a General Circulation Model (GCM).
Currently, GCMs are focusing on the simulation of the temperature and circulation changes caused by prescribed ozone and volcanic aerosol properties. Hansen et al. [1992] applied the GISS GCM, which has a coarse horizontal resolution of 8° latitude by10° longitude and only 1-2 layers in the stratosphere, to simulate the Post-Pinatubo atmosphere. Therefore, the dynamical interaction between the stratosphere and troposphere in that model was very simplified. Graf et al. [1993] investigated the relation between the northern hemisphere circulation and the surface air anomalies after the Pinatubo eruption by using the results of a perpetual January simulation with the ECHAM-2 GCM forced by an artificial decrease of solar radiation at the top of the model, and calculated the radiative heating "off-line". They concluded that the observed winter warming over the northern hemisphere continents is associated with the enhancement of the polar night jet (PNJ) due to anomalous radiative heating in the tropical lower stratosphere by the volcanic aerosol. A set of ensemble simulations has recently been performed by Kirchner et al. [1999] to study the climate response of the atmosphere to the Pinatubo eruption. They used the ECHAM-4 GCM and realistic aerosol optical properties to perform three sets of 2-year-long simulations with and without volcanic-aerosol forcing and with different sets of sea surface temperature (SST). It was concluded that the model simulates reasonably well the observed general cooling in the troposphere and winter warming near the surface over northern hemisphere continents. However, about a 4K warming in the lower tropical stratosphere was simulated which exceeds the observed value by up to 2K. It was pointed out that this overestimation of the warming can be explained by the absence of the QBO in the model and by the cooling of the lower stratosphere due to volcanically induced ozone depletion. Yang [1999] and also studied the temperature and circulation changes observed following the Pinatubo eruption using singular-value decomposition and the UIUC stratosphere-troposphere GCM, with emphases on identification and separation of the temperature changes induced by the Pinatubo aerosol and the overlapping ENSO events. However, it is difficult to predict what the model response would be if interactive ozone chemistry was introduced into the model because of the strong non-linearity of the coupled model and the very complicated system of feedbacks in the fully interactive model. It should be noted that several GCMs with interactive chemistry (Zhao et al., [1997]; Knight et al. [1998]) have already been developed and used to estimate the changes in the stratosphere caused by the Pinatubo eruption. However, they mainly addressed the problem of ozone depletion and the partition of the reactive nitrogen and chlorine. They have not provided or discussed any information about the temperature and circulation changes in the stratosphere. Moreover, the above-mentioned stratospheric GCMs are not able to simulate any tropospheric processes , hence they cannot be used to analyze stratosphere-troposphere interactions. To fill this gap we have performed the first-ever Post-Pinatubo simulations with a Stratosphere-Troposphere GCM that has interactive chemistry (ST-GCM/PC).
2. Model description and experimental set-up
We present here the changes in the temperature, circulation and chemical composition in the post-Pinatubo atmosphere simulated by the UIUC 24-layer Troposphere-Stratosphere GCM with interactive chemistry. The model has been described elsewhere [Rozanov et al., 2000]. It takes into account the solar and infrared radiation perturbations by sulfate aerosol and heterogeneous reactions on/in sulfate particles. The links between the chemical and physical processes are maintained by the exchange of the mixing ratios of radiatively active species between the radiation and chemistry-transport parts of the model. This model design assures that almost all physical processes invoked by the products of the volcanic eruption are taken into account. The only exception is that the formation and development of the aerosol layer is not simulated interactively. We use the time-dependent distribution of aerosol optical properties obtained from Stenchikov et al. [1998] and Andronova et al. [1999] in the radiation code of the ST-GCM/PC to calculate the fluxes of solar and longwave radiation in the presence of the volcanic aerosol. The Pinatubo aerosol extinction at 1.02 micron from the same dataset was used to calculate the time-dependent volcanic aerosol surface area density according to the equation proposed by Thomason et al. [1997]. The data have been used for the calculation of the heterogeneous reaction constants in the chemical routine of the ST-GCM/PC.
We have carried out three 2-year-long ensemble simulations to estimate the statistical significance of the results. Each ensemble simulation consists of five separate model runs. The first ensemble run is the control run (run "C") without any changes in the external forcing. In the second run (run "F") we introduced the volcanic-aerosol perturbations into the radiation and chemical parts of the model. In the third run (run "R") we introduced the volcanic-aerosol perturbations only for the calculation of the radiation fluxes. Thus comparison of the results of runs F and R will elucidate the contribution of the chemical processes. For all the simulations we used the climatological sea surface temperature (SST). Here we present some preliminary results of the model run F. The analysis of run R will be presented elsewhere. In the figures, the regions where the changes of the different quantities are statistically significant at better than the 20% level are bounded by a red-and-black line.
3. Chemical composition in the lower stratosphere
Analyses of the gaseous composition of the atmosphere during the Post-Pinatubo period have been presented in many publications (see the extensive reviews by Solomon [1999] and Toohey [1995]). The most important chemical processes in the Post-Pinatubo atmosphere are connected with the presence of liquid sulfate aerosol, which provides a medium for heterogeneous reactions. The most important among them for the tropical lower stratosphere is the hydrolysis of N2O5 (N2O5 + H2O = 2HNO3) inside the aerosol particles. This reaction, which is rather fast in the cold tropical lower stratosphere, should lead to a substantial decrease of NOx (NO+NO2) and an increase of HNO3. Figures 1 and 2 illustrate the simulated changes of zonal monthly mean NOx and HNO3 mixing ratios in the lower stratosphere. The model matches well the theoretically predicted partitioning of the total reactive nitrogen. The HNO3 mixing ratio started to increase just after the eruption mainly in the middle stratosphere. Then, the HNO3 mixing ratio increases into the middle and high latitude area due to both transport processes and formation from the in situ hydrolysis of N2O5. The HNO3 increase reaches its maximum values (~ 2 ppbv) in the middle latitudes during the earlier autumn season over the southern and northern middle-latitude areas. As a consequence of the N2O5 removal, the NOx mixing ratio decreases almost everywhere by about 0.5 ppbv. The maximum decrease of NOx (~ 1 ppbv) occurs during the summer and earlier autumn seasons over the middle and high-latitude areas in both hemispheres.
Figure 1. Changes (ppbv) of the monthly zonal-mean HNO3 mixing ratio at 50 hPa after the eruption
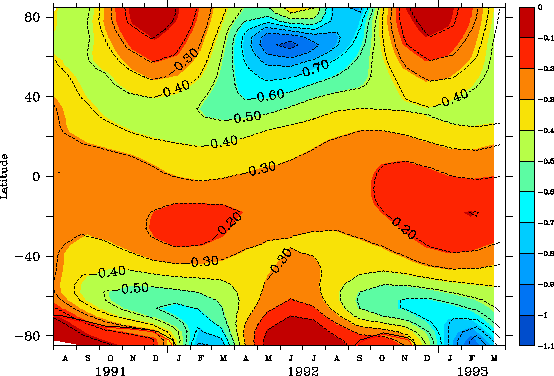
Figure 2. Changes (ppbv) of the monthly zonal-mean NOx mixing ratio at 50 hPa after the eruption
Heterogeneous reactions of chlorine compounds in the stratosphere, together with low NOx abundance, lead to the transition of passive chlorine (HCl and ClONO2) into chemically active radicals. Figure 3 illustrates the changes of the active chlorine mixing ratio after the eruption in the lower stratosphere simulated by the model. The model results show that the chlorine activation is the most intensive (~ 100 pptv) during the winter in the middle latitudes of both hemispheres because of the cold temperature there and the availability of the HCl and ClONO2 for heterogeneous conversion. These results are in reasonable agreement with the observational data presented by Solomon [1999]. It should be noted that all the above-mentioned changes of NOx, HNO3 and ClOx are statistically significant almost everywhere except inside the winter polar vortices.
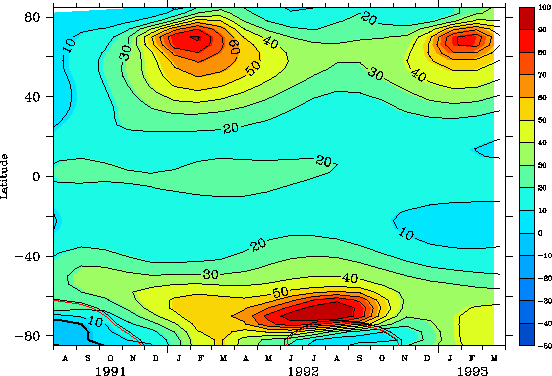
Figure 3. Changes (pptv) of the monthly zonal-mean ClOx mixing ratio at 50 hPa after the eruption
The simulated changes of the ozone in the tropical stratosphere after the eruption are presented in Figure 4. The ozone mixing ratio decreases slightly in the lower stratosphere below 28 km mainly due to destruction by active chlorine. The elevated temperature in the post-Pinatubo stratosphere and the enhanced intensities of the upward motion, which deliver the poor-ozone air from the lowermost part of the stratosphere and upper troposphere, could also play a role. However, this ozone depletion is not robust, which means that the magnitude and even sign of the ozone changes here are different for different members of the ensemble, that is, the effect strongly depends on the background conditions. Above 28 km the ozone mixing ratio significantly increases, albeit the magnitude is not very large. This feature can be explained by the above-mentioned NOx deactivation.
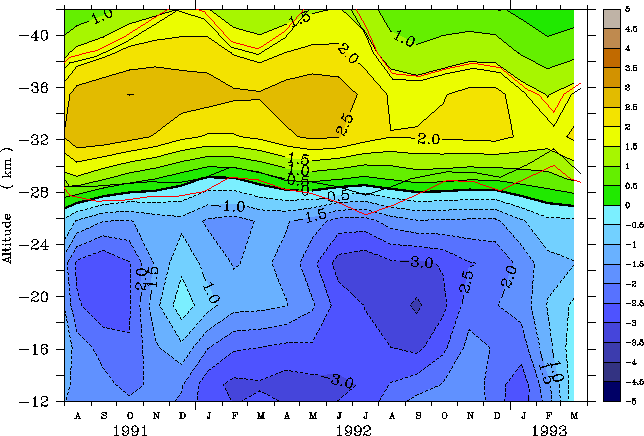
Figure 4. Changes (%) of the monthly zonal-mean O3 mixing ratio in the tropics after the eruption
The change of the ozone mixing ratio in the lower stratosphere is presented in Figure 5. It can be seen that the ozone is decreased by the Pinatubo effect almost everywhere over the globe. The depletion in the tropics and middle latitudes is rather weak (~ 4-6%) and, as mentioned earlier, not statistically significant. The effect is more complicated over the high latitudes where the ozone significantly decreases during the winter and spring in the both hemispheres. This can be explained by the changes in dynamics, because the ozone during winter and early spring is very sensitive to the transport processes, while during the late spring and summer the chemical transformation of ozone dominates.
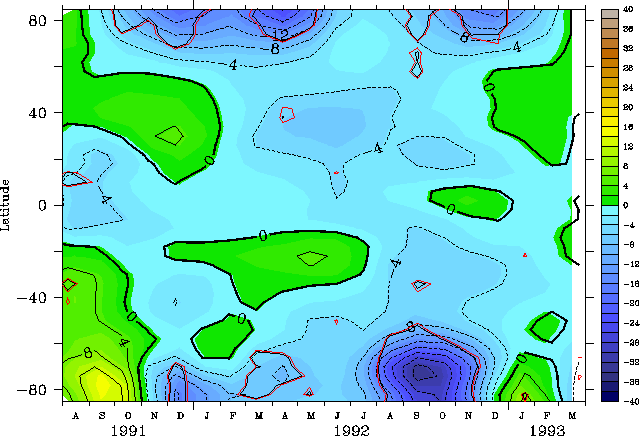
Figure 5. Changes (%) of the monthly zonal-mean O3 mixing ratio at 70 hPa after the eruption
The change of total column ozone (TCO), presented in Figure 6, mainly coincides with the ozone changes in the lower stratosphere. The simulated tropical TCO is almost insensitive to the volcanic eruption. Its change does not exceed 2% and is not statistically significant because the signal is weaker than the simulated interannual variability. A noticeable (more then 10%) total ozone depletion caused by the intensification of polar night jet (PNJ) and chlorine activation was simulated over the high-latitude area in the Northern Hemisphere during the first winter and spring seasons after the eruption and during the second late winter - spring season in the Southern Hemisphere. The simulated magnitude of the TCO change is in reasonable agreement with the data published by Angell [1997b]. He found on the basis of the observation data analysis that the tropical ozone depletion is only about 2%. He also detected a significant (~ 10%) ozone loss in the northern middle and high latitudes. The model underestimates the TCO decrease in the Northern middle latitude found by Angell, at least in the ensemble mean. However, it should be noted that Angell did not detect any ozone change over the southern high-latitudes
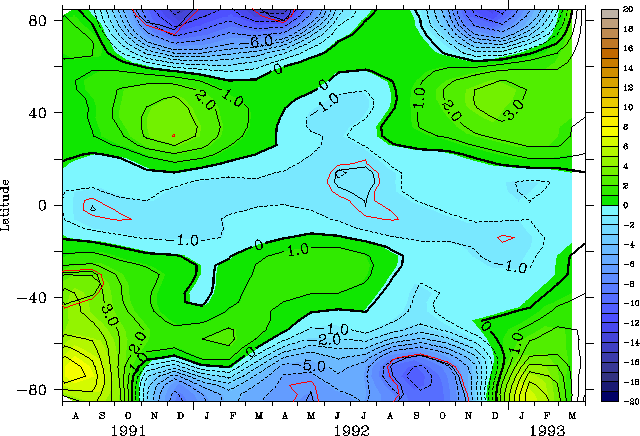
Figure 6. Changes (%) of the monthly zonal-mean total column ozone after the eruption
Almost the same conclusions about the underestimation of the total ozone depletion in the northern middle latitudes can be made if we compare our results with the data published by Randel et al. [1995]. The total ozone depletion detected by Randel et al. [1995] looks much more pronounced than our results especially around 60°N. This can be partially explained by the fact that we compare a particular year of the observations with the ensemble mean of the simulations. Because the total ozone changes depend on the background conditions, the use of the ensemble mean inevitably smoothes and decreases the effects. This kind of analysis is a useful tool for forecasting the behavior of the atmospheric system during future volcanic eruptions because it predicts the most robust features of the post-volcanic changes which will appear no matter what the prevailing state of the atmosphere is. However, for comparison of the simulation results with the observational data for any particular year, it is better to use that member of the simulation ensemble which is closest to the actual meteorological conditions for the chosen year. In particular, we can try to use for this purpose some a priori information about the observed total ozone changes for winter-spring 1991/92, for example, and make a reasonable choice among our 5 ensemble members.
The monthly zonal-mean total ozone changes for all 5 members of ensemble are presented in Figure 7, together with their average. Using a priori information we may conclude that at least the first and fourth members of the ensemble should be excluded from the analysis because they produce a total ozone increase over the Northern Hemisphere. The remaining members provide a much better agreement with the observational data. This means that the state of the atmosphere for the second, third and fifth members of ensemble is likely closer to the actual meteorological conditions after Pinatubo eruption.
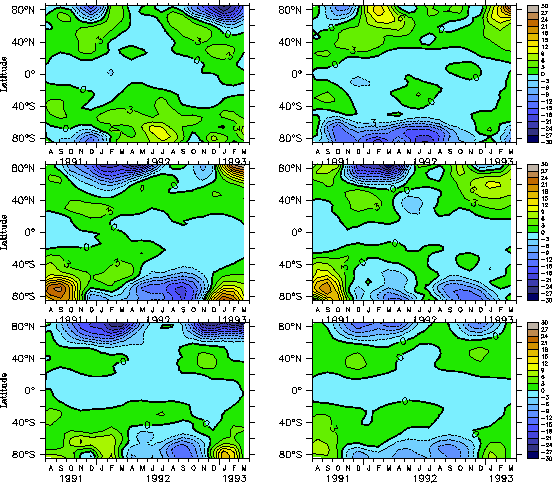
Figure 7. Changes (%) of the monthly zonal-mean total ozone after the eruption for all 5 members of ensemble and ensemble mean (bottom right).
4. Temperature and zonal wind in the lower stratosphere
The time-latitude cross-section of the temperature change in the lower stratosphere (at 30 hPa) simulated by the model is presented in Figure 8. The main features of the simulated temperature changes are the warming by up to 4.5K) of the lower stratosphere in the wide area from 40°S to 40°N due to the absorption of solar near-infrared and longwave radiation by the aerosol (e.g., Stenchikov et al., [1998]; Andronova et al., [1999]), the dynamically driven warming during the summer season over middle and high latitudes of both hemispheres, and the cooling over the high latitudes during the winter and spring seasons resulting from the intensification of the polar-night jets. {How does this work?} All the above-mentioned changes also occur in the lower stratosphere up to 100 hPa, and they are statistically significant.
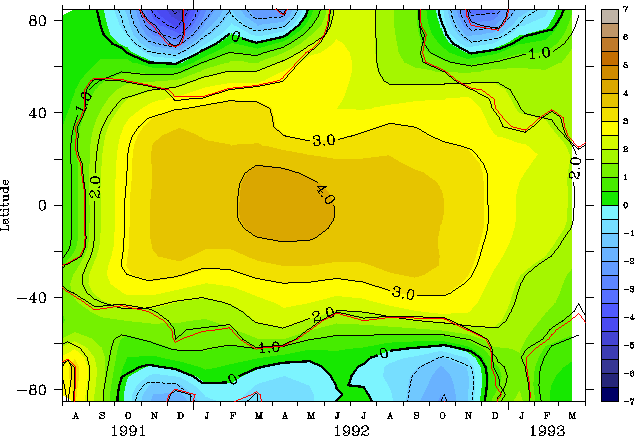
Figure 8. Changes (K) of the monthly zonal-mean temperature at 30 hPa after the eruption.
Angell [1997a] also demonstrated the significant influence of the volcanic aerosol on the temperature in the stratosphere. He found that the largest warming after the Pinatubo eruption, of up to 3K after extraction of the QBO signal, occurred in the tropics between 50 hPa and 100 hPa. He has also shown that some cooling in the high latitudes of the lower stratosphere took place following the Pinatubo eruption. These results have been confirmed by Kirchner et al. [1999] and Yang [1999] on the basis of temperature-anomaly analyses during the Post-Pinatubo period relative to the 1968-1997 NCEP climatology.
The simulated temperature changes presented here are close to those simulated by Kirchner et al. [1999] with the ECHAM-4 GCM forced by a similar radiative aerosol forcing. It was pointed out by Kirchner et al. [1999] that the ozone-depletion effect may reduce the magnitude of the simulated warming in the stratosphere. However, according to our results the ozone depletion simulated by our model in the lower stratosphere is not large enough to substantially cool the stratosphere. The almost exact coincidence of our results with the warming obtained by Kirchner et al. [1999] allows us to conclude that the direct radiative heating by the aerosol most likely determines the magnitude of the lower stratosphere warming. Therefore, the causes of disagreement between model simulations and analysis of the observations could be connected with the parameterization of the aerosol physical or/and radiative properties.
As illustrated Figure 9, he simulated warming of the stratosphere and the consequent increase in the pole-to-equator temperature difference leads to the intensification of the polar night jets (PNJs) The change in the zonal-wind intensities are more pronounced (up to 10 m/s) in the Northern Hemisphere than in the Southern Hemisphere and are statistically significant in December 1991, April 1991 and December 1993. In the Southern Hemisphere the acceleration of the zonal wind is significant only in December 1991.
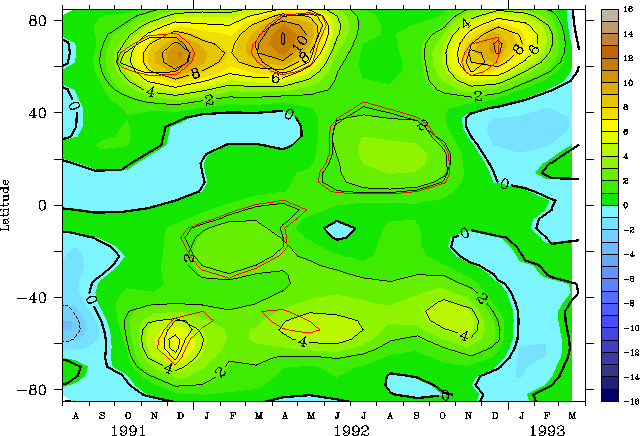
Figure 9. Changes (m/s) of the monthly zonal-mean zonal wind at 30 hPa after the eruption.
5. December 1991
The simulated changes in the atmosphere after the Pinatubo eruption seem to be most interesting in December 1991, when the warming in the lower tropical stratosphere produced the most pronounced changes in the atmosphere over the northern high latitudes. The latitude-altitude cross-sections of the monthly zonal-mean temperature and zonal wind changes for December 1991 are presented in Figures 10 and 11. The results show substantial warming in the tropical lower stratosphere which increases the latitudinal temperature gradient in the lower and middle stratosphere and produces a significant intensification of the northern PNJ. In comparison with the results obtained by Kirchner et al. [1999], the acceleration of the zonal wind in our model is much more pronounced. This can be partially explained by an additional heating in the middle stratosphere related to the ozone increase there (Figure 4). The acceleration of the zonal wind produces significant cooling of up to 10K in the lower stratosphere over the northern high-latitude area and heating of almost the same magnitude in the upper stratosphere.

Figure 10. Changes (K) of the monthly zonal-mean temperature for December 1991

Figure 11. Changes (m/s) of the monthly zonal-mean zonal wind for December 1991
Figures 12, 13, and 14 illustrate the geographical distributions of the changes due to the Pinatubo eruption in geopotential height, temperature and total ozone changes for December 1991. Significant geopotential height changes of up to 500 m at 50 hPa confirm the intensification of the polar vortex (see Figure 12). Subsequent cooling of the area inside the polar vortex (Figure 13) and dynamically driven total ozone depletion are also illustrated in Figure 14. The intensification of the zonal wind also leads to changes in the tropospheric planetary-wave propagation. It was pointed out by many authors (e.g., Robock, 2000 and references therein) that such changes are responsible for the winter warming in the Northern Hemisphere after a major volcanic eruption.

Figure 12. Changes of the monthly mean geopotential height (m) at 50 hPa for December 1991.
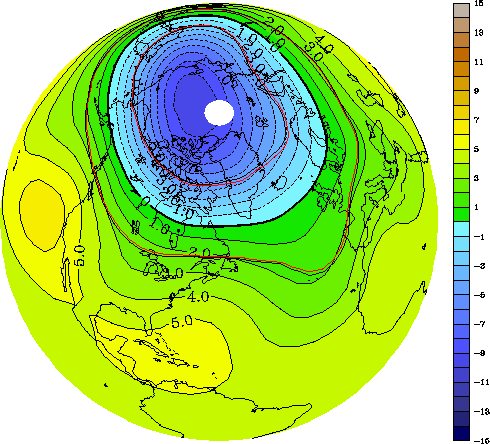
Figure 13. Changes of the monthly mean temperature (K) at 50 hPa for December 1991.
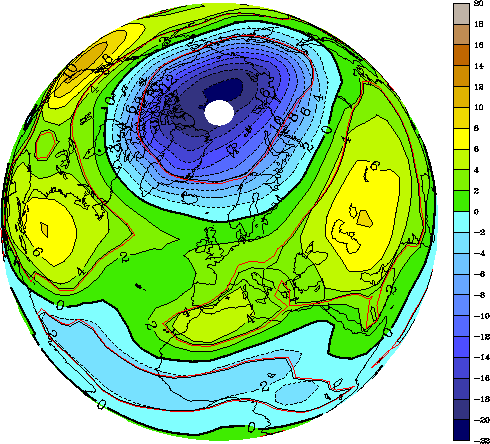
Figure 14. Changes of the monthly mean total column ozone (%) for December 1991.
The changes of the simulated near-surface air temperature in December 1991 (Figure 15) confirm that our model is capable of reproducing this effect. Analysis of the temperature deviation from the control run reveals a very good agreement of the simulated temperature anomalies with the observed anomalies presented by Robock [2000]. During the winter, a statistically significant warming near the surface can be seen in the model results over North America, North Europe and Siberia. The model also captures well the cooling over Greenland, Alaska and Central Asia.
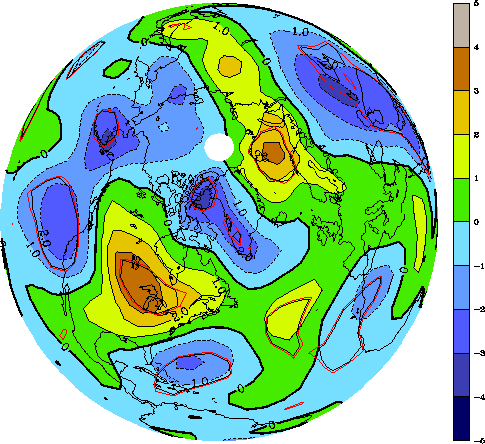
Figure 15. Changes of the monthly mean temperature (K) at 1000 hPa for December 1991
6. Conclusions
We have performed the first simulation of the effects of the Pinatubo eruption by a Stratosphere-Troposphere GCM with interactive chemistry. The simulated partitioning within the chlorine and nitrogen groups, as well as the ozone changes are in reasonable agreement with observations. However, the ozone changes are statistically significant only in the middle and upper stratosphere. The model simulates an ozone loss of up to 15% over the northern middle and high-latitudes. The magnitude of the total-ozone depletion is generally less than the "observed" total ozone anomalies, however, some members of the ensemble are in better agreement with the observed ozone anomalies. The model simulates a pronounced stratospheric warming in the tropics, however, the simulated warming exceeds the "observed" anomalies by 1-2 K. The model matches well the intensification of the polar-night jet in December 1991 and the boreal winter warming of the surface air over the U.S., northern Europe and Russia, as well as the cooling over the Greenland, Alaska and Central Asia.
References
Angell, J. K., Stratospheric warming due to Agung, El Chichón, and Pinatubo taking into account the quasi-biennial oscillation, J. Geophys. Res., 102, 9479-9485, 1997a.
Angell, J. K., Estimated impact of Agung, El Chichón, and Pinatubo volcanic eruption on global and regional total ozone after adjustment for the Quasi-Biennial Oscillation, Geophys. Res. Lett., 24, 647-650, 1997b.
Angell J. K., Impact of El Chichón and Pinatubo on ozonesonde profiles in north extratropics, Geophys. Res. Lett, 25, 4485-4488, 1998.
Andronova N. G., et al., Radiative forcing by volcanic aerosols from 1850 to 1994, J. Geophys. Res., 104, 16807-16826, 1999.
Bodeker, G. E., Boyd, I. S., Matthews W. A., Trends and variability in vertical ozone and temperature profiles measured by ozonesonde at Lauder, New Zealand: 1986-1996, J. Geophys. Res., 103, 28661-28681, 1998.
Brasseur G., and C. Granier, Mount-Pinatubo Aerosols, Chlorofluorocarbons, And Ozone Depletion, Science, 257, 1239-1242, 1992.
Graf, H. F., I. Kirchner, A. Robock, and I. Schult, Pinatubo eruption winter climate effects: model versus observations, Climate Dynamics, 9, 81-93, 1993.
Jackman CH, Fleming EL, Chandra S, Considine D.B, Rosenfield JE, Past, present, and future modeled ozone trends with comparisons to observed trends,. J. Geophys. Res., 101, 28753-28767, 1996.
Hansen, J., G. Russell, R. Ruedy, and M. Sato, Potential climate impact of Mount Pinatubo eruption, Geophys. Res. Lettr., 19, 215-218, 1992.
Kinnison D.E., K.E. Grant, P.S. Connell, D.A. Rotman, D.J. Wuebbles, The Chemical And Radiative Effects Of The Mount-Pinatubo Eruption, J. Geophys. Res., ., 99, 25705-25731, 1994.
Kirchner, I. et al., Climate model simulation of winter warming and summer cooling following the 1991 Mount Pinatubo volcanic eruption, J. Geophys. Res., 104, 19039-19055, 1999.
Knight J.R., J. Austin, R. G. Grainger, A. Lambert, A three-dimensional model simulation of the impact of Mt. Pinatubo aerosol on the Antarctic ozone hole, Quart. J. Roy. Meteor. Soc., 124, 1527-1558, 1998
McCormic, M. P., L. W. Thomason, and C. R. Trepte, Atmospheric effects of the Mt Pinatubo eruption, Nature, 373, 399-404, 1995.
Pitari, G., and V. Rizi, An estimate of the chemical and radiative perturbation of stratospheric ozone following the eruption of Mt. Pinatubo, J. Atmos. Sci., 50, 3260-3276, 1993.
Randel, W. J., F. Wu, J. M. Russell III, J. W. Waters, and L. Frodivaux, ozone and temperature changes in the stratosphere following the eruption of Mount Pinatubo, J. Geophys. Res., 100, 16753-16764, 1995.
Rampino, M. R., and R. Self, Sulphur-rich volcanic eruptions and stratospheric aerosols, Nature, 310, 677-679, 1984.
Robock, A., and J. Mao, The volcanic signal in surface temperature observations, J. Climate, 8, 1086-1103, 1995.
Robock, A., Volcanic eruptions and climate, Rev. of Geophys., 38, 191-219, 2000.
Rosenfield J.E., D. B. Considine, P. E. Meade, J. T. Bacmeister, C. H. Jackman, M. R. Schoeberl, Stratospheric effects of Mount Pinatubo aerosol studied with a coupled two-dimensional model, J. Geophys. Res., 102, 3649-3670, 1997.
Rozanov, E. V., M. E. Schlesinger, and V. A. Zubov, The UIUC 3-D Stratosphere/Troposphere General Circulation Model with Interactive Ozone Photochemistry: 15-year Control Run Climatology, J. Geophys. Res., 2000 (submitted).
Sahai Y., V. Kirchhoff, P. G. Alvala, Pinatubo eruptions: Effects on stratospheric O3 and SO2 over Brasil, J. Atm. and Sol.-Terr Physics, 59, 265-269, 1997
Solomon, S., et al., The role of aerosol variations in anthropogenic ozone depletion at northern midlatitudes, J. Geophys. Res., 101, 6713-6727, 1996.
Solomon, S., Stratospheric ozone depletion: A review of concept and history, Rev. of Geophysics, 37, 275-316, 1999.
Stenchikov, G. L. et al., Radiative forcing from the 1991 Mt. Pinatubo volcanic eruption, J. Geophys. Res., 103, 13837-13857, 1998.
Thomason, L. W., L. R. Poole, T. Deshler, A global climatology of stratospheric aerosol surface area density deduced from Stratospheric Aerosol and Gas Experiment II measurements: 1984-1994, J. Geophys. Res., 102, 8967-8976, 1997.
Tie, X. X., G. P. Brasseur, B. Briegleb, and C. Granier, Two-dimensional simulation of Pinatubo aerosol and its effect on stratospheric ozone, , J. Geophys. Res., 99, 20545-20562, 1994.
Toohey, D. W., A critical review of stratospheric chemistry research in the U.S.: 1991-1994, U.S. Natl. Rep. Int. Union Geod. Geophys. 1991-1994, Rev. Geophys., 33, 759-773, 1995.
Yang, F.-L., Radiative forcing and climatic impact of the Mount Pinatubo volcanic eruption, Ph.D. thesis, Univ. of Illinois at Urbana-Champaign, 1999.
Zhao X., R. P. Turco, CYJ Kai, S. Elliott, Aerosol-induced chemical perturbations of stratospheric ozone: Three-dimensional simulations and analysis of mechanisms, J. Geophys. Res., ., 102, 3617-3637, 1997
Back to
| Session 1 : Stratospheric Processes and their Role in Climate | Session 2 : Stratospheric Indicators of Climate Change |
| Session 3 : Modelling and Diagnosis of Stratospheric Effects on Climate | Session 4 : UV Observations and Modelling |
| AuthorData | |
| Home Page | |