Previous: Temperature and zonal wind in the lower stratosphere Next: Conclusions Up: Ext. Abst.
5. December 1991
The simulated changes in the atmosphere after the Pinatubo eruption seem to be most interesting in December 1991, when the warming in the lower tropical stratosphere produced the most pronounced changes in the atmosphere over the northern high latitudes. The latitude-altitude cross-sections of the monthly zonal-mean temperature and zonal wind changes for December 1991 are presented in Figures 10 and 11. The results show substantial warming in the tropical lower stratosphere which increases the latitudinal temperature gradient in the lower and middle stratosphere and produces a significant intensification of the northern PNJ. In comparison with the results obtained by Kirchner et al. [1999], the acceleration of the zonal wind in our model is much more pronounced. This can be partially explained by an additional heating in the middle stratosphere related to the ozone increase there (Figure 4). The acceleration of the zonal wind produces significant cooling of up to 10K in the lower stratosphere over the northern high-latitude area and heating of almost the same magnitude in the upper stratosphere.

Figure 10. Changes (K) of the monthly zonal-mean temperature for December 1991

Figure 11. Changes (m/s) of the monthly zonal-mean zonal wind for December 1991
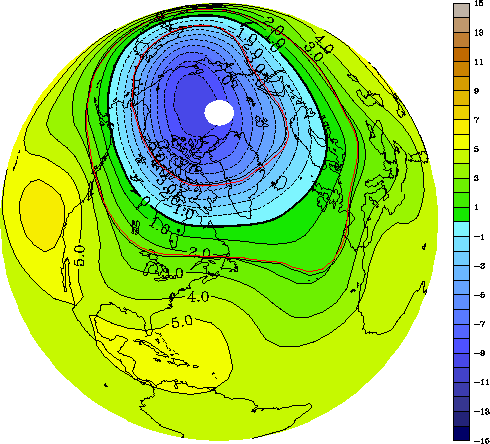
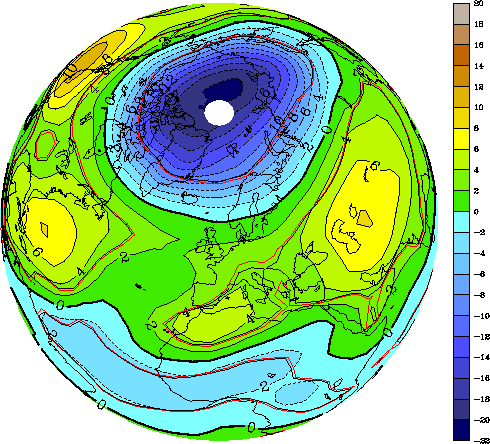
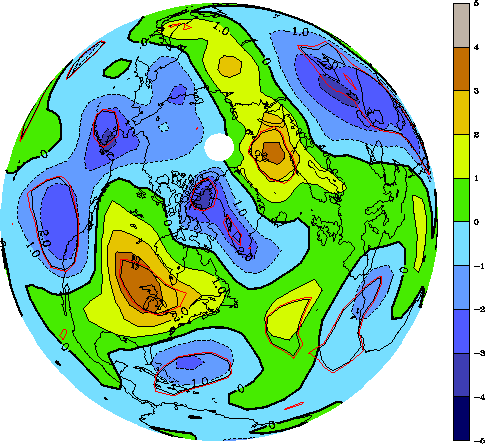
Figures 12, 13, and 14 illustrate the geographical distributions of the changes due to the Pinatubo eruption in geopotential height, temperature and total ozone changes for December 1991. Significant geopotential height changes of up to 500 m at 50 hPa confirm the intensification of the polar vortex (see Figure 12). Subsequent cooling of the area inside the polar vortex (Figure 13) and dynamically driven total ozone depletion are also illustrated in Figure 14. The intensification of the zonal wind also leads to changes in the tropospheric planetary-wave propagation. It was pointed out by many authors (e.g., Robock, 2000 and references therein) that such changes are responsible for the winter warming in the Northern Hemisphere after a major volcanic eruption.

Figure 12. Changes of the monthly mean geopotential height (m) at 50 hPa for December 1991.
The changes of the simulated near-surface air temperature in December 1991 (Figure 15) confirm that our model is capable of reproducing this effect. Analysis of the temperature deviation from the control run reveals a very good agreement of the simulated temperature anomalies with the observed anomalies presented by Robock [2000]. During the winter, a statistically significant warming near the surface can be seen in the model results over North America, North Europe and Siberia. The model also captures well the cooling over Greenland, Alaska and Central Asia.

Figure 13. Changes of the monthly mean temperature (K) at 50 hPa for December 1991.

Figure 14. Changes of the monthly mean total column ozone (%) for December 1991.

Figure 15. Changes of the monthly mean temperature (K) at 1000 hPa for December 1991