E. Rozanov, M. Schlesinger, F. Yang, S. Malyshev, N. Andronova, V. Zubov, and T. Egorova

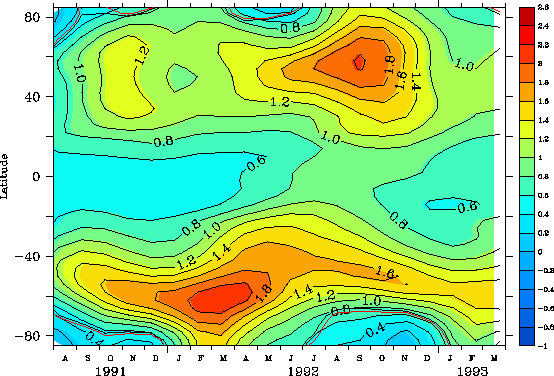
Figure 1. Changes (ppbv) of the monthly zonal-mean HNO3 mixing ratio at 50 hPa after the eruption
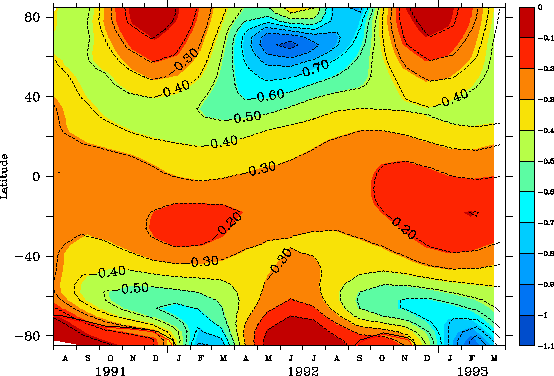
Figure 2. Changes (ppbv) of the monthly zonal-mean NOx mixing ratio at 50 hPa after the eruption
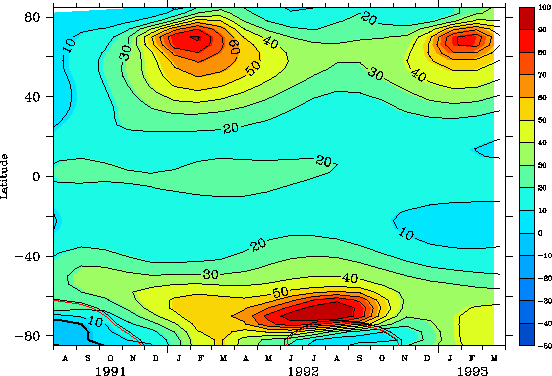
Figure 3. Changes (pptv) of the monthly zonal-mean ClOx mixing ratio at 50 hPa after the eruption
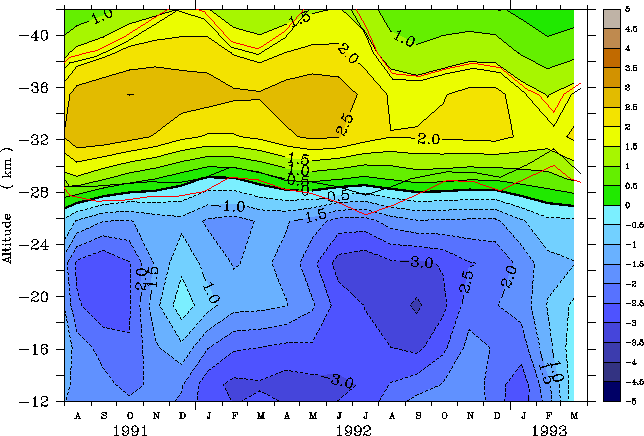
Figure 4. Changes (%) of the monthly zonal-mean O3 mixing ratio in the tropics after the eruption
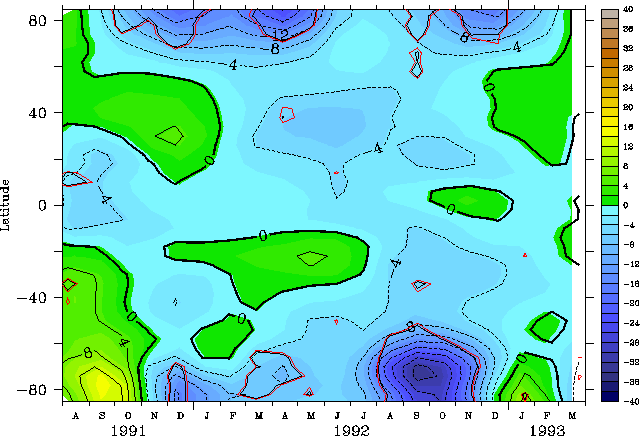
Figure 5. Changes (%) of the monthly zonal-mean O3 mixing ratio at 70 hPa after the eruption
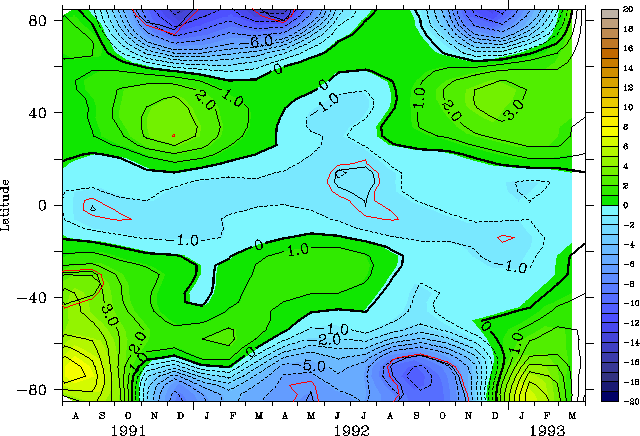
Figure 6. Changes (%) of the monthly zonal-mean total column ozone after the eruption
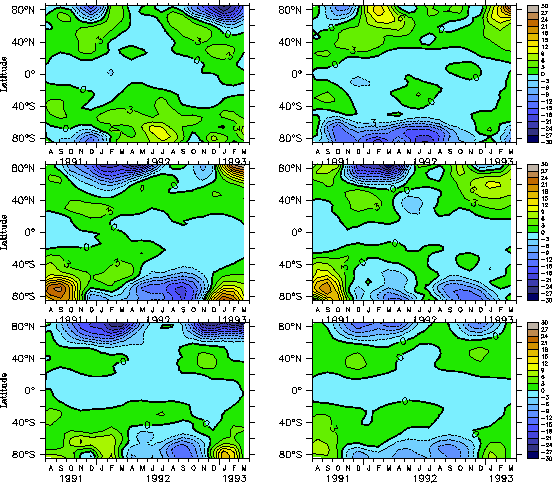
Figure 7. Changes (%) of the monthly zonal-mean total ozone after the eruption for all 5 members of ensemble and ensemble mean (bottom right).
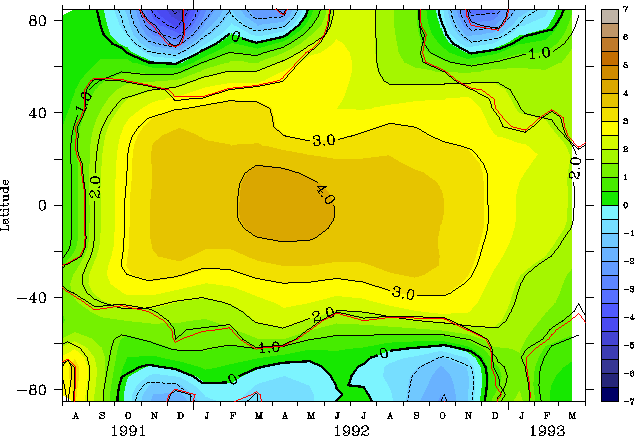
Figure 8. Changes (K) of the monthly zonal-mean temperature at 30 hPa after the eruption.
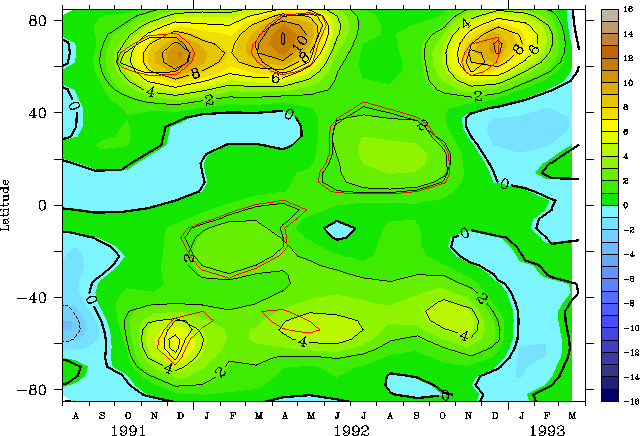
Figure 9. Changes (m/s) of the monthly zonal-mean zonal wind at 30 hPa after the eruption.

Figure 10. Changes (K) of the monthly zonal-mean temperature for December 1991

Figure 11. Changes (m/s) of the monthly zonal-mean zonal wind for December 1991

Figure 12. Changes of the monthly mean geopotential height (m) at 50 hPa for December 1991.
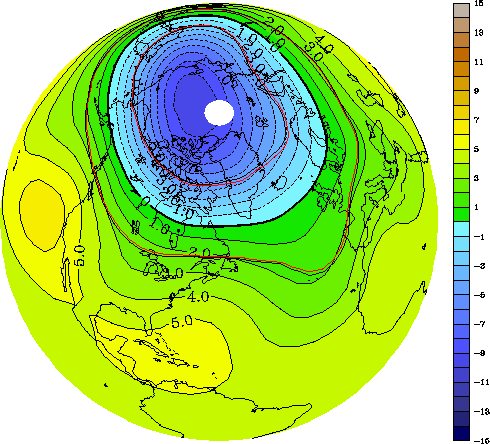
Figure 13. Changes of the monthly mean temperature (K) at 50 hPa for December 1991.
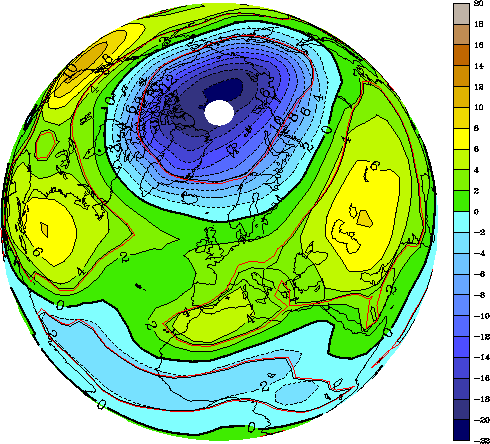
Figure 14. Changes of the monthly mean total column ozone (%) for December 1991.
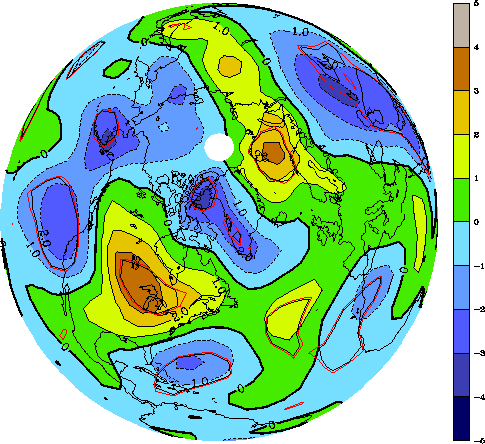
Figure 15. Changes of the monthly mean temperature (K) at 1000 hPa for December 1991