Previous:Model description and experimental set-up Next: Temperature and zonal wind in the lower stratosphere Up: Ext. Abst.
3. Chemical composition in the lower stratosphere
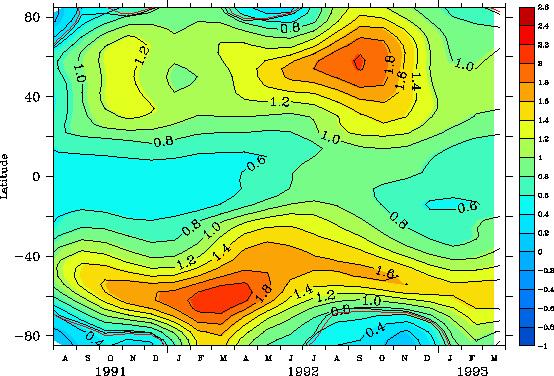
Analyses of the gaseous composition of the atmosphere during the Post-Pinatubo period have been presented in many publications (see the extensive reviews by Solomon [1999] and Toohey [1995]). The most important chemical processes in the Post-Pinatubo atmosphere are connected with the presence of liquid sulfate aerosol, which provides a medium for heterogeneous reactions. The most important among them for the tropical lower stratosphere is the hydrolysis of N2O5 (N2O5 + H2O = 2HNO3) inside the aerosol particles. This reaction, which is rather fast in the cold tropical lower stratosphere, should lead to a substantial decrease of NOx (NO+NO2) and an increase of HNO3. Figures 1 and 2 illustrate the simulated changes of zonal monthly mean NOx and HNO3 mixing ratios in the lower stratosphere. The model matches well the theoretically predicted partitioning of the total reactive nitrogen. The HNO3 mixing ratio started to increase just after the eruption mainly in the middle stratosphere. Then, the HNO3 mixing ratio increases into the middle and high latitude area due to both transport processes and formation from the in situ hydrolysis of N2O5. The HNO3 increase reaches its maximum values (~ 2 ppbv) in the middle latitudes during the earlier autumn season over the southern and northern middle-latitude areas. As a consequence of the N2O5 removal, the NOx mixing ratio decreases almost everywhere by about 0.5 ppbv. The maximum decrease of NOx (~ 1 ppbv) occurs during the summer and earlier autumn seasons over the middle and high-latitude areas in both hemispheres.

Figure 1. Changes (ppbv) of the monthly zonal-mean HNO3 mixing ratio at 50 hPa after the eruption
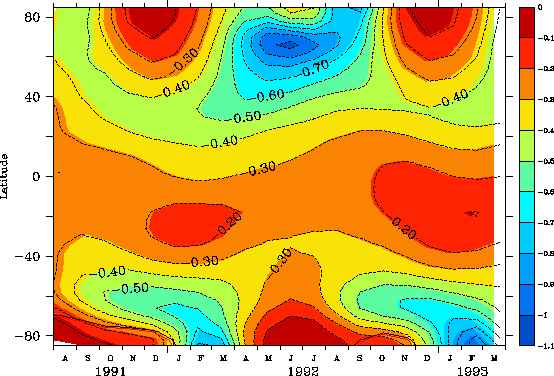
Figure 2. Changes (ppbv) of the monthly zonal-mean NOx mixing ratio at 50 hPa after the eruption
Heterogeneous reactions of chlorine compounds in the stratosphere, together with low NOx abundance, lead to the transition of passive chlorine (HCl and ClONO2) into chemically active radicals. Figure 3 illustrates the changes of the active chlorine mixing ratio after the eruption in the lower stratosphere simulated by the model. The model results show that the chlorine activation is the most intensive (~ 100 pptv) during the winter in the middle latitudes of both hemispheres because of the cold temperature there and the availability of the HCl and ClONO2 for heterogeneous conversion. These results are in reasonable agreement with the observational data presented by Solomon [1999]. It should be noted that all the above-mentioned changes of NOx, HNO3 and ClOx are statistically significant almost everywhere except inside the winter polar vortices.
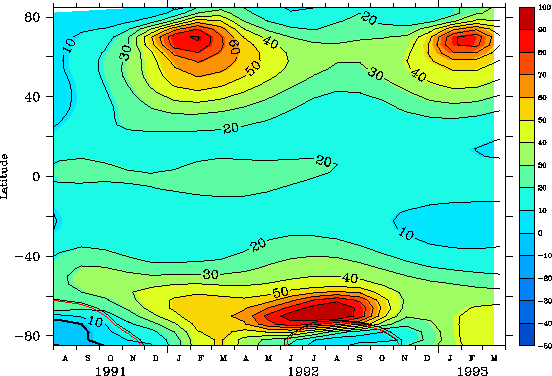
Figure 3. Changes (pptv) of the monthly zonal-mean ClOx mixing ratio at 50 hPa after the eruption
The simulated changes of the ozone in the tropical stratosphere after the eruption are presented in Figure 4. The ozone mixing ratio decreases slightly in the lower stratosphere below 28 km mainly due to destruction by active chlorine. The elevated temperature in the post-Pinatubo stratosphere and the enhanced intensities of the upward motion, which deliver the poor-ozone air from the lowermost part of the stratosphere and upper troposphere, could also play a role. However, this ozone depletion is not robust, which means that the magnitude and even sign of the ozone changes here are different for different members of the ensemble, that is, the effect strongly depends on the background conditions. Above 28 km the ozone mixing ratio significantly increases, albeit the magnitude is not very large. This feature can be explained by the above-mentioned NOx deactivation.
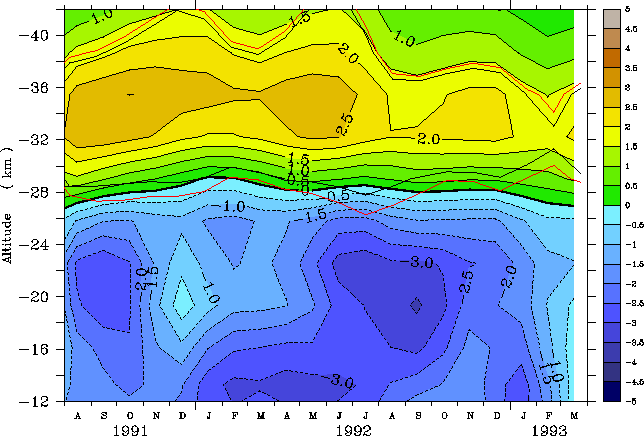
Figure 4. Changes (%) of the monthly zonal-mean O3 mixing ratio in the tropics after the eruption
The change of the ozone mixing ratio in the lower stratosphere is presented in Figure 5. It can be seen that the ozone is decreased by the Pinatubo effect almost everywhere over the globe. The depletion in the tropics and middle latitudes is rather weak (~ 4-6%) and, as mentioned earlier, not statistically significant. The effect is more complicated over the high latitudes where the ozone significantly decreases during the winter and spring in the both hemispheres. This can be explained by the changes in dynamics, because the ozone during winter and early spring is very sensitive to the transport processes, while during the late spring and summer the chemical transformation of ozone dominates.
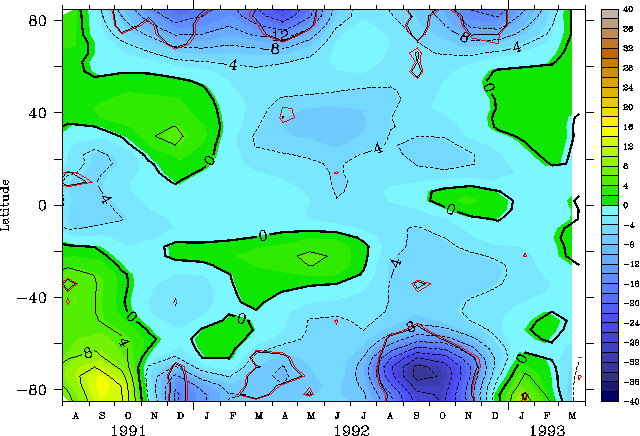
Figure 5. Changes (%) of the monthly zonal-mean O3 mixing ratio at 70 hPa after the eruption
The change of total column ozone (TCO), presented in Figure 6, mainly coincides with the ozone changes in the lower stratosphere. The simulated tropical TCO is almost insensitive to the volcanic eruption. Its change does not exceed 2% and is not statistically significant because the signal is weaker than the simulated interannual variability. A noticeable (more then 10%) total ozone depletion caused by the intensification of polar night jet (PNJ) and chlorine activation was simulated over the high-latitude area in the Northern Hemisphere during the first winter and spring seasons after the eruption and during the second late winter - spring season in the Southern Hemisphere. The simulated magnitude of the TCO change is in reasonable agreement with the data published by Angell [1997b]. He found on the basis of the observation data analysis that the tropical ozone depletion is only about 2%. He also detected a significant (~ 10%) ozone loss in the northern middle and high latitudes. The model underestimates the TCO decrease in the Northern middle latitude found by Angell, at least in the ensemble mean. However, it should be noted that Angell did not detect any ozone change over the southern high-latitudes
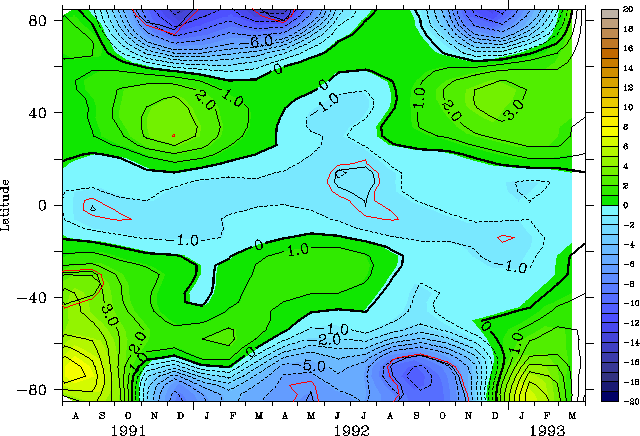
Figure 6. Changes (%) of the monthly zonal-mean total column ozone after the eruption
Almost the same conclusions about the underestimation of the total ozone depletion in the northern middle latitudes can be made if we compare our results with the data published by Randel et al. [1995]. The total ozone depletion detected by Randel et al. [1995] looks much more pronounced than our results especially around 60°N. This can be partially explained by the fact that we compare a particular year of the observations with the ensemble mean of the simulations. Because the total ozone changes depend on the background conditions, the use of the ensemble mean inevitably smoothes and decreases the effects. This kind of analysis is a useful tool for forecasting the behavior of the atmospheric system during future volcanic eruptions because it predicts the most robust features of the post-volcanic changes which will appear no matter what the prevailing state of the atmosphere is. However, for comparison of the simulation results with the observational data for any particular year, it is better to use that member of the simulation ensemble which is closest to the actual meteorological conditions for the chosen year. In particular, we can try to use for this purpose some a priori information about the observed total ozone changes for winter-spring 1991/92, for example, and make a reasonable choice among our 5 ensemble members.
The monthly zonal-mean total ozone changes for all 5 members of ensemble are presented in Figure 7, together with their average. Using a priori information we may conclude that at least the first and fourth members of the ensemble should be excluded from the analysis because they produce a total ozone increase over the Northern Hemisphere. The remaining members provide a much better agreement with the observational data. This means that the state of the atmosphere for the second, third and fifth members of ensemble is likely closer to the actual meteorological conditions after Pinatubo eruption.
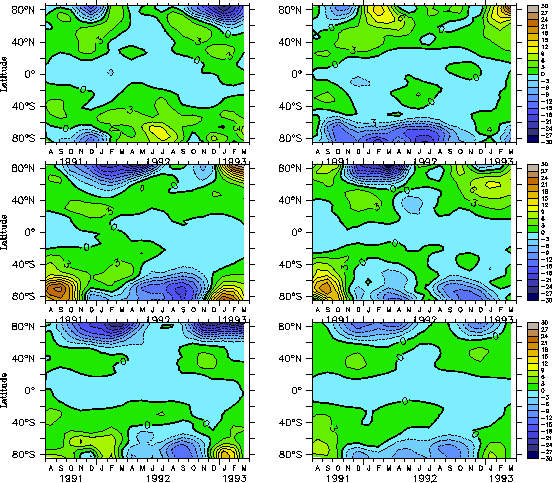
Figure 7. Changes (%) of the monthly zonal-mean total ozone after the eruption for all 5 members of ensemble and ensemble mean (bottom right).