

Long term global stratospheric circulation analysis by spectral
expansions
Tomas Halenka
Dept. of Meteorology and Environment Protection, Fac. of Mathem.
and Physics, Charles University, VÝHolesovickach 2, Prague 8,
Czech Republic
E-mail: tomas.halenka@mff.cuni.cz
FIGURES
Abstract
Ý
To give an objective characteristics of circulation patterns the
spectral structure of stratospheric fields is analyzed to compare
the long-term behaviour and connections to some extra-terrestrial
influence and circulation patterns. Two sources of data became
available for this study, reanalyses of geopotential and temperature
from Free University in Berlin available in 50, 30 and 10 hPa
levels covering unregularly the period of 1976-96 that we have
analysed in terms of spherical harmonics and huge database of
reanalyses from NCEP, where appropriate spectral coefficients
are available for period 1948-now four times per day in 28 levels
for vorticity, divergence, temperature, etc. Temporal analysis
of significant spherical harmonics is introduced as well as the
comparison of their changes with respect to the changes of different
sets of solar, geomagnetic and global circulation indices. Quite
strong connections to a set of 3extraterrestrial" parameters appear
for four trough shape of polar vortex. The natural variability
connected to the extraterrestrial influence is studied as well
as interannual variability with the emphasis to the QBO and ENSO.
The systematic review of the appropriate correlations is presented
and attempt to find some special case study is discussed. The
influence on the tropospheric circulation is also discussed in
terms of coefficients of spherical harmonics.
Introduction
Atmospheric circulation of different scales, as well as the distribution
of some trace gases (ozone) is believed to be influenced by solar
and geomagnetic activity (van Loon and Labitzke, 1993; Kodera, 1991; Bucha, 1993; BochnÌcek
et al., 1993). Many more or less probable explanations of the observed correlations
were also given by Tinsley and Dean (1991), Hood (1995) and Hood et al. (1995). These extra-terrestrial factors are often correlated with the
parameters describing the oscillations of global atmospheric system
such as QBO and ENSO with very impressive results (Baldwin and Dunkerton, 1997, Salby,1995, Labitzke and van Loon,
1988, van Loon and Labitzke, 1993).
As many attempts were made in dealing with connections between
the changes in circulation of different scales and interannual
factors, such as solar and geomagnetic activity parameters, internal
oscillations of the atmospheric system (QBO, ENSO, North Atlantic
Oscillations - NAO or others), as many approaches were introduced
in these attempts. The standard approach in describing stratospheric
fields is the use of the amplitude of the principal zonal wave
numbers and their variability, mainly during winter and spring
(Naujokat and Labitzke,1993). These parameters are able to reflect polar vortex distorsion
or breakdown, and allow us to inspect changes in large-scale stratospheric
circulation quickly. But this approach does not include processes
of synoptic and sub-synoptic scales whose origins are at lower
latitudes. In our previous studies (e.g., Halenka and Mlch, 1996) we analysed the connections between the ozone profile structure
and circulation patterns characterized in terms of the standard
classification of synoptic types (Gerstengarbe et al.,1993). Even though this approach (based on a subjective classification
of tropospheric circulation) does not seem to be convenient for
such purposes concerning mainly lower stratosphere circulation,
it is capable of providing new insights into this problem through
the very close connection between the winter upper troposphere
and the lower stratosphere (Petzoldt et al., 1994; Holton and Tan, 1980, 1982). Interesting results concerning changes in synoptic variability
have also been presented by Goeber and Hense (1995). Therefore, the need for parameters which are able to encompass
a wide range of scales leads to the application of complex decomposition
of stratospheric fields by spectral method as shown in Halenka
and Mlch (1998). This technique is more complicated in the sense
of interpretation, however, it provides a very comprehensive survey
of circulation characteristics. Being quite smooth and regular
without larger small-scale disturbances, stratospheric fields
could be spectrally represented in terms of only a very few significant
wave components of low wave numbers. Simple characteristics of
the circumpolar vortex might thus become available, which would
provide us good possibility of further analysis.
Data and spectral decomposition
We have used the 50, 30 and 10 hPa level of stratospheric geopotential
and temperature data of the 21-year period 1976 to 1996 from the
Free University Berlin. As daily values were not available regularly
every day during whole year, we finally used the monthly means
of spectral coefficients. We analyzed all the midnight data in
the northern hemisphere at 64 gridpoints on each of 32 Gaussian
latitudes. Using the standard algorithm of the spectral method,
we applied Fourier decomposition along the Gaussian latitudes
and transformation in terms of associated Legendre's polynomials
in meridional direction obtaining the spectral coefficients which
are generally complex (for detailes see, e.g., Bourke et al., 1977, Haltiner and Williams, 1980, Machenhauer,
1979). It should be pointed out that the decomposition is good enough
to provide substantial information about the circulation patterns.
For the rhomboidal truncation by wavenumber 7 the comparison of
the original field and the field reconstructed from the truncated
spectral domain is under 1% of difference for the geopotential
and slightly worse for the temperature. Even for truncation by
wave number 5 only a very limited area displays a higher error,
the difference generally remaining very low.
Most of results presented here is based on this data analysis.
Moreover, we used for the analysis a huge database of reanalyses
from NCEP as well , where just appropriate spectral coefficients
are available for period 1948-now four times per day in 28 levels
for vorticity, divergence, temperature, etc. in triangular truncation
by wavenumber 64.
Ý
Preliminary analysis
Fig. 1 and Fig. 2 display the annual cycles of some significant
wave numbers for geopotential and temperature, respectively. There
are some wave numbers where the analog between the field and the
spectral representation is straightforward, however, for the other
numbers it is rather cumbersome. The behaviour of the ''absolute''
component 1-1 is analogous to the general seasonal cycle of pressure
surfaces and temperature in the stratosphere. Further components
m-n describe the variation of the polar vortex parameters, m reffering to the number of troughs and ridges (waves) and n to the intensity of the polar vortex. Fig. 3 and Fig. 4 show
the interannual variability for the annual mean values of significant
wave numbers again for geopotential and temperature, respectively.
Here we can clearly see, e.g., the influence of the Mt. Pinatubo
eruption in 1991 on some of them, especially as regards temperature
(1992 – T 1-3, …, T 2-5, T 3-5, G 2-5 …). The absence of the absolute
component 1-1 in both figures is due to appropriate scaling; these
wave numbers are presented in Fig. 5 and Fig. 6 for geopotential
and temperature, respectively. Typical courses of component 1-1
both for the geopotential and temperature appear to be quite stable,
being a little more variable during the warm seasons (northern
hemisphere). The double cycle seems to be typical for the other
component, e.g. 1-3, apparently with higher variability during
the cold seasons (see Fig. 7). This also applies to component
3-3 with its usual maximum in winter and minimum in summer (see
Fig. 8, both for geopotential). For NCEP reanalysis we present
just simple figures of the courses of wavenumbers of the zeroth
and first order in longitude during whole period, i.e. from 1948
to 1997 (see Fig. 9 and Fig. 10). For some of them the well expressed
trends can be seen as well as the oscillations which can display
QBO, for some of them two regimes seems to be acceptable splitted
by around the year 1973.

Figure 1. Annual cycle of significant spherical harmonics components (except
wave number 1-1) of spectral decomposition of geopotential height
on 30 hPa level.

Figure 2. Annual cycle of significant spherical harmonics components (except
wave number 1-1) of spectral decomposition of temperature on 30
hPa level.
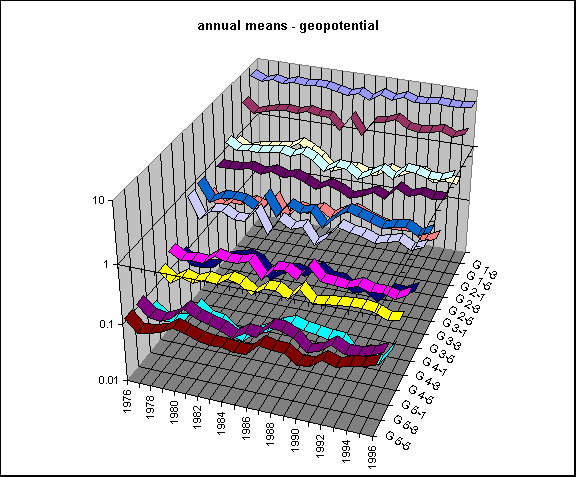
Figure 3. Annual means of significant spherical harmonics components (except
wave number 1-1) of spectral decomposition of geopotential height
on 30 hPa level.

Figure 4. Annual means of significant spherical harmonics components (except
wave number 1-1) of spectral decomposition of temperature on 30
hPa level.
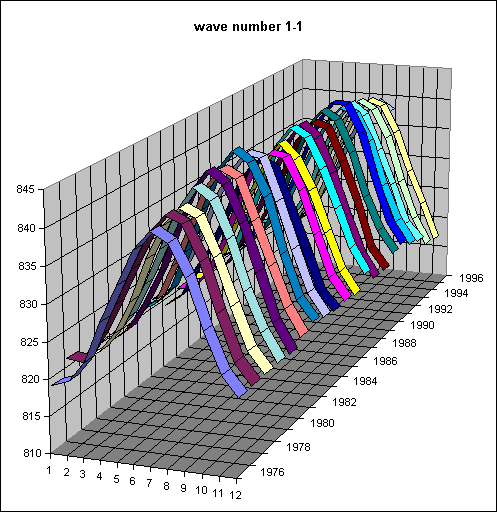
Figure 5. Interannual variability of 1-1 spherical harmonics component
of spectral decomposition of geopotential height on 30 hPa level.
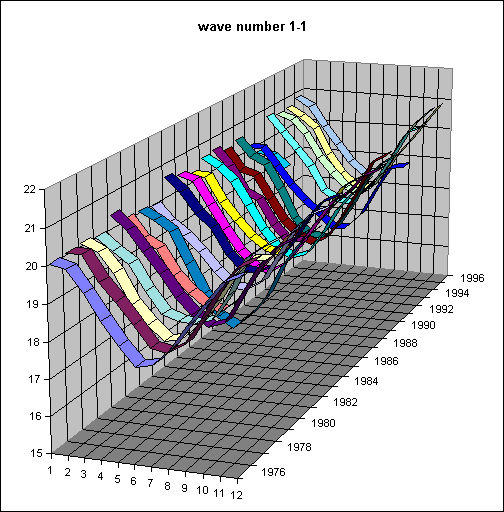
Figure 6. Interannual variability of 1-1 spherical harmonics components
of spectral decomposition of temperature on 30 hPa level.
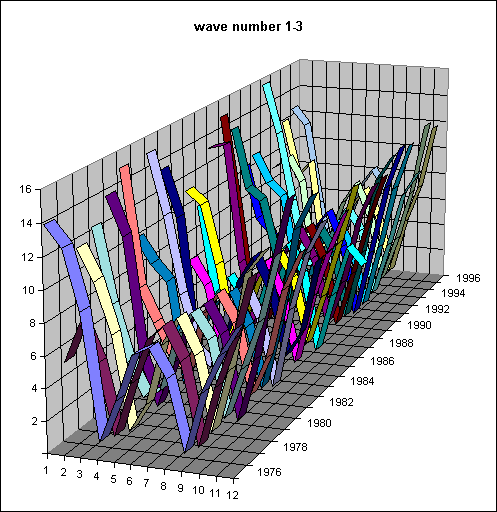
Figure 7. Interannual variability of 1-3 spherical harmonics component
of spectral decomposition of geopotential height on 30 hPa level.
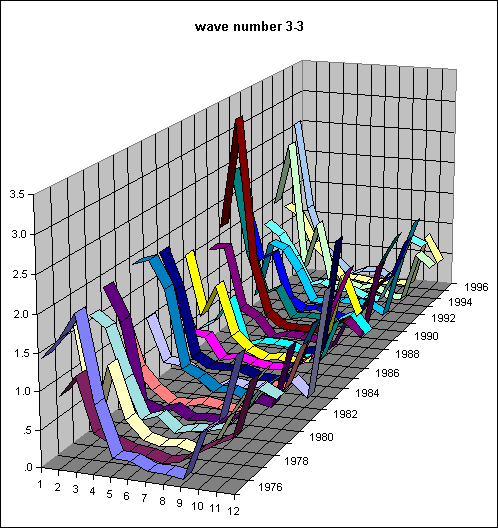
Figure 8. Interannual variability of 3-3 spherical harmonics component
of spectral decomposition of geopotential height on 30 hPa level.

Figure 9. Interannual variability of spherical harmonics components based
on NCEP reanalysis of vorticity on 50 hPa level (1-1 to 1-6 adequate
to previous notation).

Figure 10. Interannual variability of spherical harmonics components based
on NCEP reanalysis of vorticity on 50 hPa level (2-1 to 2-6 adequate
to previous notation).
Interannual variability study
Based on the monthly values of all spectral coefficients obtained
from the reanalyses of Free University in Berlin we tested the
variability of the data by means of normalized standard deviations
of the coefficients, both for geopotential and temperature. It
is plotted in Fig. 11 and Fig. 12, respectively, as a ratio of
the standard deviation and the mean for all data from available
levels. The high variability can be seen just for low significant
wavenumbers, in accordance with the main principles and objections
of the method. We also present on similar figures for geopotential
the sensitivity of the spherical harmonics components to quasi-biennial
oscillations for 30 and 50 hPa levels by means of the ratio between
the values for westerly and easterly phase of QBO (see Fig. 13)
as well as for variability of these phases by means of the ratio
of standard deviations (see Fig. 14).

Figure 11. The variability of the data of FUB by means of normalized standard
deviations of the coefficients for geopotential.

Figure 12. The variability of the data of FUB by means of normalized standard
deviations of the coefficients for temperature.

Figure 13. The sensitivity of the data of FUB for westerly and easterly
phase of QBO for geopotential.

Figure 14. The sensitivity of the data of FUB for variability during the
westerly and easterly phase of QBO for geopotential .
Based on the monthly values of some spectral coefficients we analyzed
the interannual variability with respect to other available factors
as well. We have used both extraterrestrial characteristics and
the parameters developed from long-term atmospheric observations.
Solar activity in terms of the F10.7 index was available from
the National Goddard Data Center, as well as geomagnetic activity
data in terms of the AP index. The latter group of factors was
created by ENSO – standardized monthly values of the Southern
Oscillations index – and QBO characteristics mentioned previously
based on standardized monthly Singapore winds at the 30 and 50
hPa levels. Some comparisons, using cross-correlation analysis
for geopotential wave number 5-1, are shown in Fig. 15 for solar
activity and in Fig. 16 for geomagnetic activity. This served
mainly to find some similarities between some coefficients and
indices and to estimate the time scale of the potential response
of the spectral coefficients to the individual parameters. To
avoid the periodicity of the annual cycle, we worked with moving
averages with a 12-month span which makes sense mainly for the
spectral coefficients, for the series of extraterrestrial indices
it yields better results due to lower dispersion. In the further
analysis of the regression relations, we have used shifted series
regarding the causality of the potential influence, i.e., extraterrestrial
parameters as lagged independent variables unlike the other "circulation
parameters" like ENSO or QBO, where the "causality" does not seem
to have the physical meanings and only criterion of the better
correlation may be accepted.

Figure 15. Cross-correlations analysis of geopotential component of wave
number 5-1 against solar activity parameter (F10.7) with lag in
months.

Figure 16. Cross-correlations analysis of geopotential component of wave
number 5-1 against geomagnetic activity index (AP) with lag in
months.
We have run numerous experiments with the linear regression model
with the significant geopotential and temperature components used
as dependent variables, series of extraterrestrial indices and
other circulation parameters with the appropriate shifts being
independent variables. In some cases it seems to be convenient
to test the influence of appropriate temperature component in
geopotential regression and vice versa. We have obtained quite
good results for some of them although for other wave numbers
it seems to be impossible to find any reliable connections. Anyway,
the method of the spectral decomposition appears to be useful
seeking possible effects in global scale. The systematic analysis
will be a subject of further studies, here we will limit ourselves
to present quite interesting results of the experiment with the
component of wave number 5-1, which corresponds to four trough
shape of polar vortex and which manifests very strong dependence.
Table 1 describes the first attempt to estimate parameters of
the linear regression model with solar and geomagnetic activity
as the only independent variables. It can be seen quite high correlation
of such a model with the smoothed data. It is evident the dominant
influence of solar activity comparing to geomagnetic activity,
which can be confirmed also in Tab. 2, where temperature component
of wave number 5-1 is included as well. It should be mentioned
that temperature actually is not independent variable with regard
to the geopotential and, moreover, our temperature record in data
is not complete in 1992, but solar activity still remains the
dominant factor of our regression analysis. The results of these
experiments are presented in Fig. 17 and Fig. 18 for both modifications
of the model, together with standardized residua comparison (see
Fig. 19). It should be mentioned here that other circulation parameters
do not help to fit better our model to the data, although it seems
that some strong events of ENSO could result in higher departures,
as well as, e.g., stratospheric warmings. Moreover, concerning
the QBO, we have tested the model for QBO positive and negative,
i.e., west and east phases, respectively. The results are even
better for the first case, the similar model gives correlation
0.967.
Table 1. Linear regression model results for geopotential component of
wave number 5-1 (Z51 smoothed by moving average – MA with 12 months
span) against solar activity (represented by F10.7 index also
smoothed – F10.7_1 and lagged by 45 months) and geomagnetic activity
(represented by AP index also smoothed – AP_1 and lagged by 42
months).
Model Summary
|
Model
|
R
|
R Square
|
Adjusted R Square
|
|
a
|
.878
|
.771
|
.770
|
|
b
|
.895
|
.801
|
.798
|
Coefficients
|
Model
|
Variable
|
B
|
Std. Error
|
Sig.
|
|
a
|
(Constant)
|
.113
|
.002
|
.000
|
| Ý |
LAGS(F10.7_1,45)
|
-3.349E-05
|
.000
|
.000
|
|
b
|
(Constant)
|
.101
|
.003
|
.000
|
| Ý |
LAGS(F10.7_1,45)
|
-3.753E-05
|
.000
|
.000
|
| Ý |
LAGS(AP_1,42)
|
1.092E-03
|
.000
|
.000
|
a Predictors: (Constant), LAGS(F10.7_1,45)
b Predictors: (Constant), LAGS(F10.7_1,45), LAGS(AP_1,42)
Dependent Variable: MA(Z51,12,12)
Ý
Table 2. Linear regression model results for geopotential component of
wave number 5-1 (Z51) against solar activity (represented by F10.7
measurement), geomagnetic activity (represented by AP index) –
similarly as in Tab.1. and temperature component of wave number
5-1 (TZ51 also smoothed by moving average – MA with 12 months
span).
Model Summary
|
Model
|
R
|
R Square
|
Adjusted R Square
|
|
a
|
.884
|
.782
|
.781
|
|
b
|
.938
|
.881
|
.879
|
|
c
|
.948
|
.899
|
.897
|
Coefficients
|
Model
|
Variable
|
B
|
Std. Error
|
Sig.
|
|
a
|
(Constant)
|
.112
|
.002
|
.000
|
| Ý |
LAGS(F10.7_1,45)
|
-3.351E-05
|
.000
|
.000
|
|
b
|
(Constant)
|
7.661E-02
|
.003
|
.000
|
| Ý |
LAGS(F10.7_1,45)
|
-2.509E-05
|
.000
|
.000
|
| Ý |
MA(TZ51,12,12)
|
.719
|
.061
|
.000
|
|
c
|
(Constant)
|
7.080E-02
|
.003
|
.000
|
| Ý |
LAGS(F10.7_1,45)
|
-2.891E-05
|
.000
|
.000
|
| Ý |
MA(TZ51,12,12)
|
.651
|
.058
|
.000
|
| Ý |
LAGS(AP_1,42)
|
8.470E-04
|
.000
|
.000
|
a Predictors: (Constant), LAGS(F10.7_1,45)
b Predictors: (Constant), LAGS(F10.7_1,45), MA(TZ51,12,12)
c Predictors: (Constant), LAGS(F10.7_1,45), MA(TZ51,12,12), LAGS(AP_1,42)
Dependent Variable: MA(Z51,12,12)
Ý
Ý

Figure 17. Linear regression analysis of the geopotential height of 30hPa
level, spectral component with wave number 5-1.

Figure 18. Linear regression analysis of the geopotential height of 30hPa
level, spectral component with wave number 5-1, improvement by
inclusion of appropriate temperature component.

Figure 19. Linear regression analysis of the geopotential height of 30hPa
level, spectral component with wave number 5-1, plots of residuals
for both the models.
Conclusions
The method presented here seems to be able to describe basic circulation
characteristics with a good possibility of further analysis. It
can help with evaluation of the effects of phenomena involved
in long term analysis in global scale, the responsibility of solar
activity on partial circulation pattern, i.e., tendency to 4-trough
structure appears to be very strong. The reasons of this dependence
are not clear at this moment, the results for other wave numbers
do not display such connections, even though some of them are
still in quite good correlation. Hopefully the method could be
good enough even for daily data to serve as a tool for case study
analyses which will be able to investigate the potential of real
physical connections better. Both this kind of studies and previous
mentioned systematic presentation of long term analyses of all
significant wave numbers, as well as for other levels, might move
us from this preliminary study to the more detailed analysis with
more important conclusions. It should be mentioned here, that
NCEP reanalys provides more data, but maybe either with respect
to more not even solar cycles or the preference of significance
of conection between the solar activity and circulation on northern
hemisphere, or both of features, the analysis of the data has
not provided us better insight to the problem.
Ý
Acknowledgements
Our thanks for the stratospheric data used in this study go to
the Free University Berlin and NCEP. We wish also to express our
thanks to the SC&C Company for the support of SPSS software used
in the Dept. of Meteorology and Environment Protection. Finally,
part of the work was done under support of the project of Charles
University Grant Agency B-GEO-97/3. The work was partly supported
in framework of research project CEZ: J13/98:113200004 as well.
Ý
References
Baldwin, M.P. and T.J. Dunkerton (1997 – in print): Biennal, Quasi-biennial
and decadal oscillations of PV in the northern hemisphere, J. Geophys. Res.
BochnÌcek, J., V. Bucha, V. Hejda and P?cha J. (1993): Winter air surface temperatures in the northern hemisphere at
different levels of geomagnetic, or solar activity and QBO phases,
Ann. Geophysicae, 11, Supplement III, C368.
Bourke, W.M., B. Mc Avaney, K. Puri, and R. Thurling (1977): Global
modelling of atmospheric flow by spectral methods. In: Methods
in Computational Physics, Vol. 17, General Circulation Models of the Atmosphere, J. Chang, Ed.,
Academic Press, 267 – 324.
Bucha, V. (1993): Direct relations between solar activity and
atmospheric circulation, its effect on changes of weather and
climate, Studia geoph. et geod., 27, 19-45.
Gerstengarbe, F. W., P.C. Werner, W. Busold, U. Ruge and K.O.
Wegener (1993): Katalog der Grosswetterlagen Europas nach Paul Hess und
Helmuth Brezowski 1881-1992, Bericht 113, Offenbach am Main.
Goeber, M., and A. Hense (1995): Long term variations of atmospheric
synoptic variability: AÝstudy based on radiosonde data from Lindenberg,
Meteorolog. Z., 4, 51-61.
Halenka, T., and P. Mlch (1996): On the relationship between vertical
ozone distribution and synoptic situations, Studia geoph. et geod., 40, 192 – 215.
Halenka, T., and P. Mlch (1998): On the spectral decomposition
of geopotential and temperature fields in the stratosphere. Studia geoph. et geod., 2, 147 –158.
Haltiner, G.J. and R.T. Williams (1980): Numerical prediction
and dynamic meteorology. John Wiley & Sons, 477pp.
Holton, JÝR., and H.-C. Tan (1980): The influence of the equatorial Quasi-Biennial Oscillation
on the global circulation at 50mb, J. Atmos. Sci., 37, 2200 – 2208.
Holton, JÝR., and H.-C. Tan (1982): The Quasi-Biennial Oscillation in the Northern Hemisphere, J. Met. Soc. Jap., 60,140 – 148.
Hood, L.L. (1995): Solar Cycle Variation of the Stratosphere,
(ed. Lon L. Hood), STEP Working Group 5 Report.
Hood, L.L., D.A. Zaff, and J.P. McCormack (1995): Dynamical contributions
to midlatitude total ozone trends in winter, Paper OZ.32, Int. Conf. on Ozone in the Lower Stratosphere, Halkidiki (Book of Abstracts, p. 42).
Kodera, K. (1991): The solar and equatorial QBO influences on
the stratospheric circulation during the early northern-hemisphere
winter, Geophys. Res. Lett., 18, 1023 – 1026.
Labitzke, K., and H. van Loon (1988): Association between the
11-year solar cycle, the QBO, and the atmosphere. Part I: The
troposphere and stratosphere on the Northern Hemisphere Winter, J. Atmos. Terr. Phys., 50, 197 – 206.
Machenhauer, B. (1979): The spectral method. In: Numerical Methods
Used in Atmospherical Models, Vol. II, GARP Publication Series, No. 17.
Naujokat, B.,and K. Labitzke (1993): Collection of reports on the Startospheric circulation during
the winters 1974/75 - 1991/92, Stratospheric Research Group, Free
University Berlin, edited by B. Naujokat and K. Labitzke.
Petzold, K., B. Naujokat, K. Neugebohren (1994): Correlation between stratospheric temperature, total ozone, and
tropospheric weather systems, Geophys. Res. Lett., 21, 1203 – 1206.
Salby, M.L. (1995): Evidence of solar variability in the atmosphere:
The solar cycle variation of the stratosphere, STEP WG5 Report,
16pp.
Tinsley, B.ÝA. and G.ÝW. Dean (1991): Apparent tropospheric response
to MeV-GeV particle flux variations, J. Geophys. Res., 96, 22283 – 22296.
van Loon, H., and K. Labitzke (1993): Review of the decadal oscillation
in the stratosphere of the northern hemisphere, J. Geophys. Res., 98, 18919 – 18922.
Back to


