Previous: Data and spectral decomposition Next: Interannual variability study Up: Ext. Abst.
Preliminary analysis
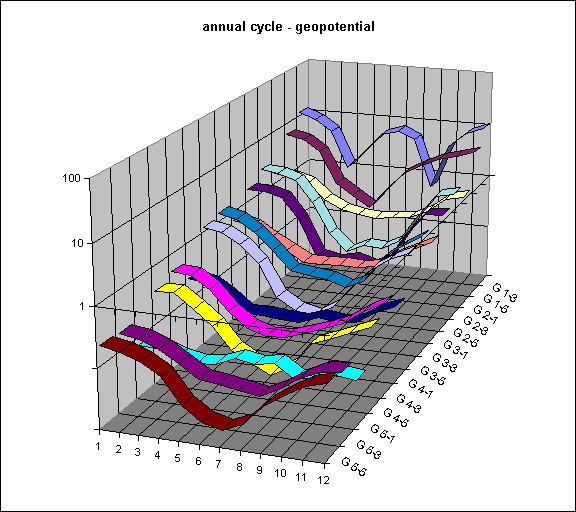
Fig. 1 and Fig. 2 display the annual cycles of some significant wave numbers for geopotential and temperature, respectively. There are some wave numbers where the analog between the field and the spectral representation is straightforward, however, for the other numbers it is rather cumbersome. The behaviour of the ''absolute'' component 1-1 is analogous to the general seasonal cycle of pressure surfaces and temperature in the stratosphere. Further components m-n describe the variation of the polar vortex parameters, m reffering to the number of troughs and ridges (waves) and n to the intensity of the polar vortex. Fig. 3 and Fig. 4 show the interannual variability for the annual mean values of significant wave numbers again for geopotential and temperature, respectively. Here we can clearly see, e.g., the influence of the Mt. Pinatubo eruption in 1991 on some of them, especially as regards temperature (1992 ö T 1-3, ·, T 2-5, T 3-5, G 2-5 ·). The absence of the absolute component 1-1 in both figures is due to appropriate scaling; these wave numbers are presented in Fig. 5 and Fig. 6 for geopotential and temperature, respectively. Typical courses of component 1-1 both for the geopotential and temperature appear to be quite stable, being a little more variable during the warm seasons (northern hemisphere). The double cycle seems to be typical for the other component, e.g. 1-3, apparently with higher variability during the cold seasons (see Fig. 7). This also applies to component 3-3 with its usual maximum in winter and minimum in summer (see Fig. 8, both for geopotential). For NCEP reanalysis we present just simple figures of the courses of wavenumbers of the zeroth and first order in longitude during whole period, i.e. from 1948 to 1997 (see Fig. 9 and Fig. 10). For some of them the well expressed trends can be seen as well as the oscillations which can display QBO, for some of them two regimes seems to be acceptable splitted by around the year 1973.
Figure 1. Annual cycle of significant spherical harmonics components (except wave number 1-1) of spectral decomposition of geopotential height on 30 hPa level.
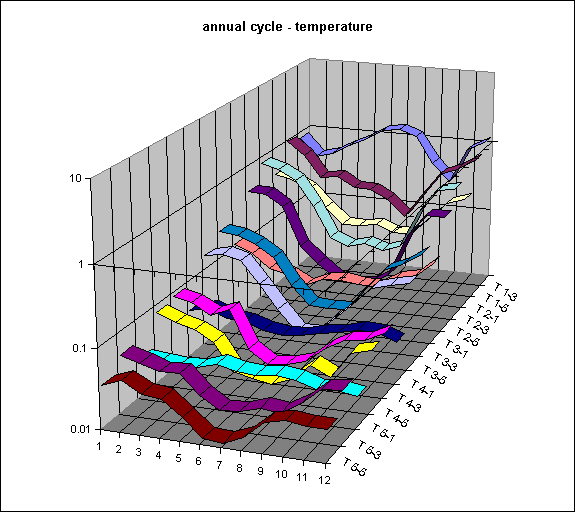
Figure 2. Annual cycle of significant spherical harmonics components (except wave number 1-1) of spectral decomposition of temperature on 30 hPa level.
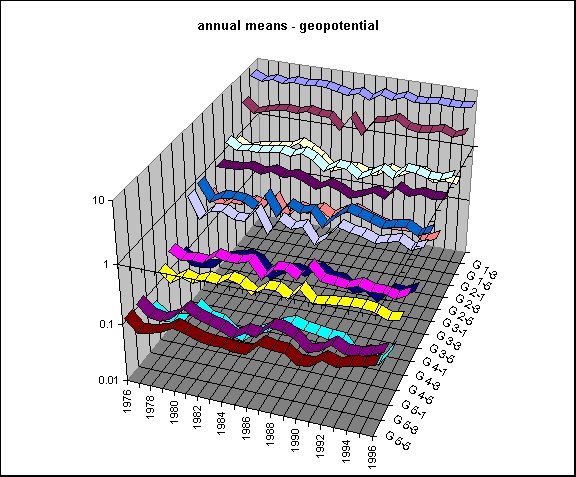
Figure 3. Annual means of significant spherical harmonics components (except wave number 1-1) of spectral decomposition of geopotential height on 30 hPa level.
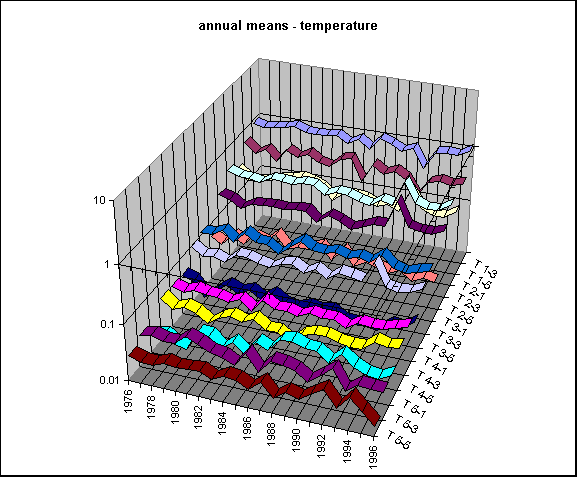
Figure 4. Annual means of significant spherical harmonics components (except wave number 1-1) of spectral decomposition of temperature on 30 hPa level.
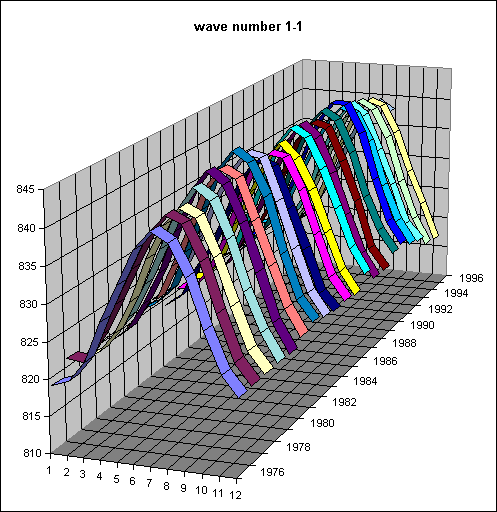
Figure 5. Interannual variability of 1-1 spherical harmonics component of spectral decomposition of geopotential height on 30 hPa level.
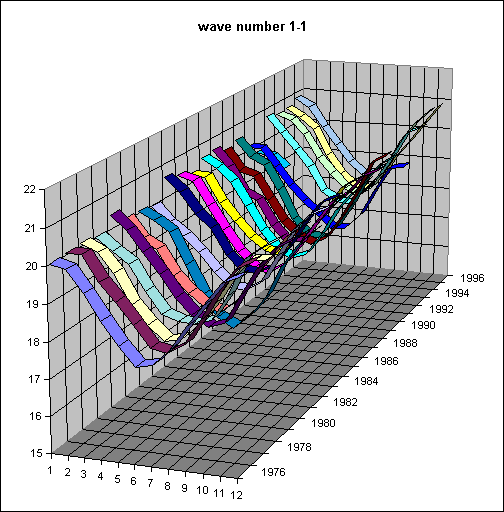
Figure 6. Interannual variability of 1-1 spherical harmonics components of spectral decomposition of temperature on 30 hPa level.
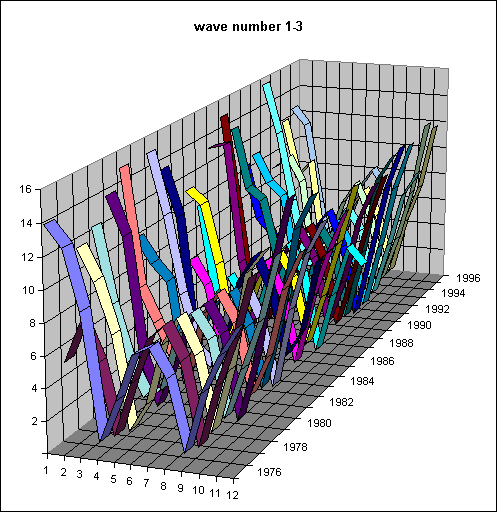
Figure 7. Interannual variability of 1-3 spherical harmonics component of spectral decomposition of geopotential height on 30 hPa level.
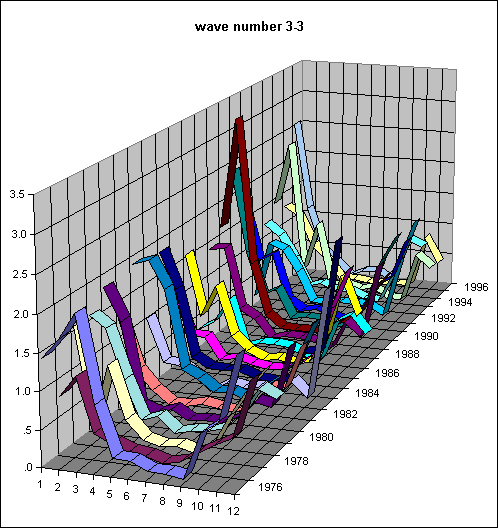
Figure 8. Interannual variability of 3-3 spherical harmonics component of spectral decomposition of geopotential height on 30 hPa level.
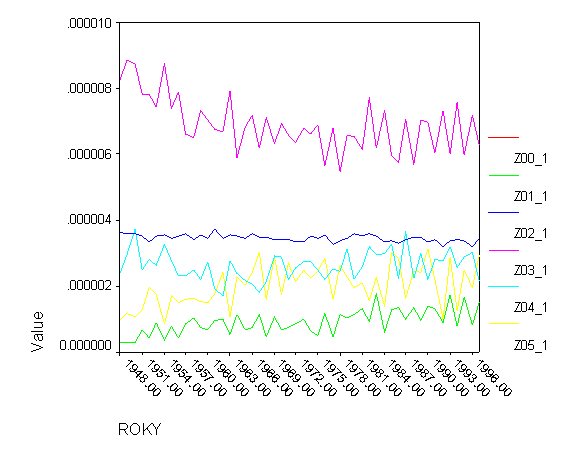
Figure 9. Interannual variability of spherical harmonics components based on NCEP reanalysis of vorticity on 50 hPa level (1-1 to 1-6 adequate to previous notation).
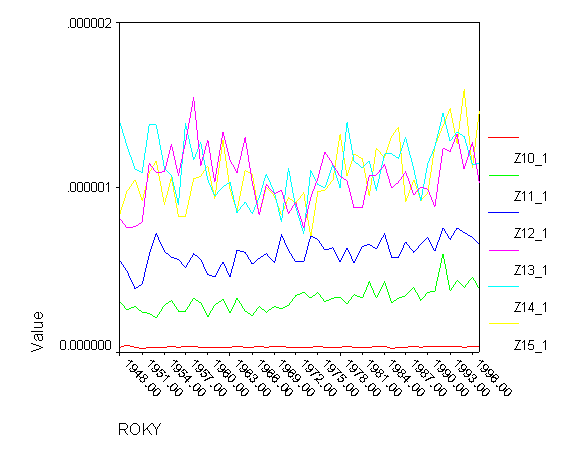
Figure 10. Interannual variability of spherical harmonics components based on NCEP reanalysis of vorticity on 50 hPa level (2-1 to 2-6 adequate to previous notation)