 |
Previous: SAFIRE/A operation during the APE-GAIA campaign Next: Validation of SAFIRE/A results Up: Ext. Abst.
First results: VMR maps of the observed species
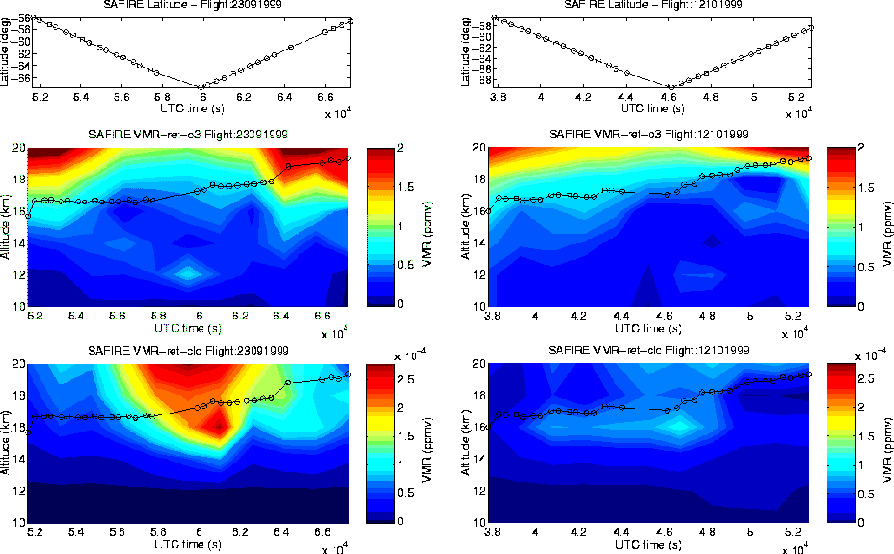
Volume mixing ratio (VMR) values are derived from limb sounding sequences through a data inversion process [2]. The results obtained for ozone and ClO in the 23/9/1999 and 12/10/1999 scientific flights are shown in figure 3. The two flights considered were performed with a similar flight path, the only differences between the two flights were the different time of the day and the different conditions of the Antarctic vortex, respectively towards the end of the ozone depletion period and at the beginning of the recovery phase.
|
During the 23/9/1999 scientific flight activation of chlorine chemistry and ozone depletion inside of the polar vortex region is evidenced by anticorrelation between ClO and ozone concentration. The crossing of the vortex edge region is also marked by sharp VMR gradients. In the 12/10/1999 scientific flight the aircraft took off earlier in the morning, so that the diurnal cycle of chlorine activation still was at its start, and this, together with vortex de-activation at the end of Antarctic winter, determines lower concentrations of active Chlorine and less evident gradients in the vortex edge.
Another example in which the SAFIRE/A horizontal and vertical resolution were exploited was in the 8/10/1999 scientific flight. In this case a filamentation in the vortex edge was forecasted by atmospheric models, and the flight was aimed at crossing the interested region. In figure 4 VMR maps for ozone and nitric acid obtained from SAFIRE/A data acquired in the 8/10/1999 flight are shown.
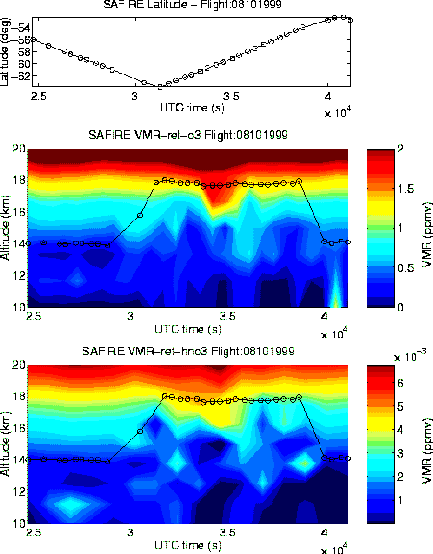 |
The filamentation is visible as a perturbation of VMR values in a well delimited region, crossed by the aircraft at about 35000 s UTC. Correlation between ozone and HNO3 further evidences this feature.