Previous: Introduction Next: AMSU comparisons with HALOEs Up: Ext. Abst.
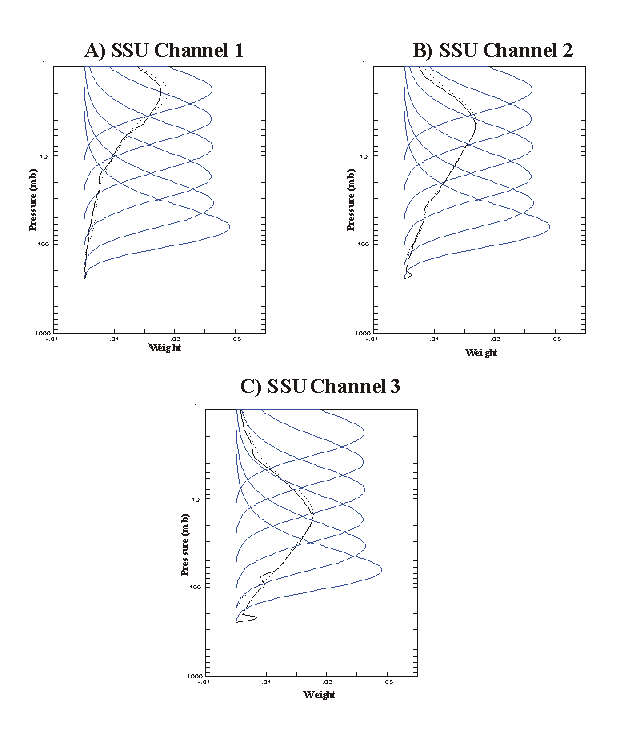
Figure 1 presents the stratospheric weighting functions of the AMSU and SSU instruments. We have simulated, by multiple regression, radiances for the 3 SSU channels from the 6 AMSU channel radiances, using a climatological collection of 1200 atmospheric temperature profiles. The SSU radiances are simulated with an RMS errors of only 0.3K. Thus, for purposes of climatological continuity, we should be able to provide, from the SSU to AMSU data, a consistent, continuous record for determinations of long-term change.
Nash and Brownscombe (1983) demonstrated that diurnal and semi-diurnal temperature variations are a source of differences in the temperatures derived from successive satellites. Temperature differences arise because of differences in the local time of observation between morning and afternoon satellites and also because afternoon NOAA satellites have precessed in their orbits. This will be rectified with the launch (expected in the year 2000) of NOAA-L, which will have a non-precessing orbit. Time of day factors affect comparisons involving CPC stratospheric analyses because the CPC analyses (Finger et al., 1993) have used both ascending and descending NOAA data. Furthermore, CPC-AMSU comparisons are affected because the equatorial crossing times of NOAA-14 and NOAA-15 are about 6 hours apart.

Figure 1. SSU channel weighting functions (solid black lines) and reconstructed SSU channel weighting functions (dashed black lines) using AMSU weighting functions (blue lines).
As an independent source of temperature information we use data from the Halogen Occultation Experiment (HALOE) from the NASA Upper Atmosphere Research Satellite (Russell et al., 1993; Hervig et al., 1996) for the period 1998 through early 1999.
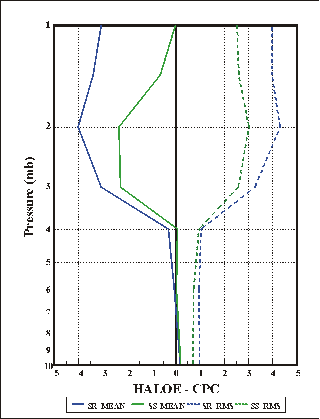
Figure 2 shows the mean and RMS statistics for HALOE minus CPC temperature comparisons, as a function of pressure. Here we compare zonal average HALOE data versus the zonal average CPC data (based on SSU observations) for each day of HALOE availability, with differences averaged by month. Thus each latitude has a varying number of comparisons. Mean differences are less than 1K from 10 to 4 hPa, increasing to as much as -4K at 2 hPa. The RMS differences are about 1K at lower levels, increasing to 4K at the upper levels. We attribute the difference between the sunrise versus sunset results of HALOE minus CPC to atmospheric diurnal and semi-diurnal tidal effects.

Figure 2. Zonal mean HALOE minus CPC mean and RMS temperature differences, for the calendar year 1998. The differences are shown for HALOE sunrise (SR) and sunset (SS). The latitude range corresponds to that shown in Figure 3.
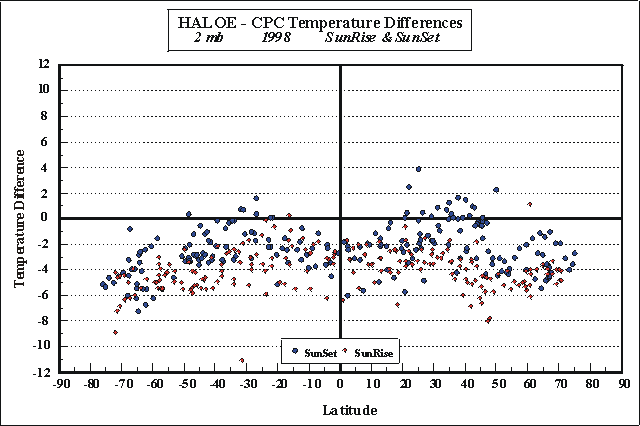
In Figure 3 the above statistical differences at 2 hPa are presented as a function of latitude. Overall, HALOE is colder than the CPC results by about 3K, as also seen in Figure 2. We note that there is a tendency for differences to be larger at the equator and at higher latitudes than at mid-latitudes.

Figure 3. Daily HALOE minus CPC zonal mean temperature differences at 2 hPa, for the year 1998. The differences are shown for HALOE sunrise and sunset.