NOAA/NWS/NCEP/Climate Prediction Center, Camp Springs MD, USA
RDC Corp/Climate Prediction Center
NOAA/NESDIS
FIGURES
Abstract
Introduction
The daily global stratospheric analyses of the Climate Prediction Center, NCEP (formerly NMC) have used temperature data from NOAA operational polar orbiting satellites. Stratospheric Sounding Unit (SSU) data since 1979 have been the major source of upper stratospheric temperature information. This will change because the last available SSU instrument was launched on NOAA-14 in 1996. The NOAA-14 SSU instrument continues to function. Meanwhile, as replacement for SSU instruments, the first Advanced Microwave Sounding Unit (AMSU) instrument on the NOAA-15 polar orbiting environmental satellite has been providing information since June 1998.
For at least the next 10 years, AMSU instruments are scheduled to operate on all NOAA polar satellites. AMSU instruments provide radiometric information from 6 stratospheric channels, compared to the 3 SSU channels, so we may expect a positive impact on stratospheric temperature retrievals. The purpose of this note is to highlight effects of this change for users of CPC stratospheric analyses and for users of NOAA polar orbiting satellite temperature information.
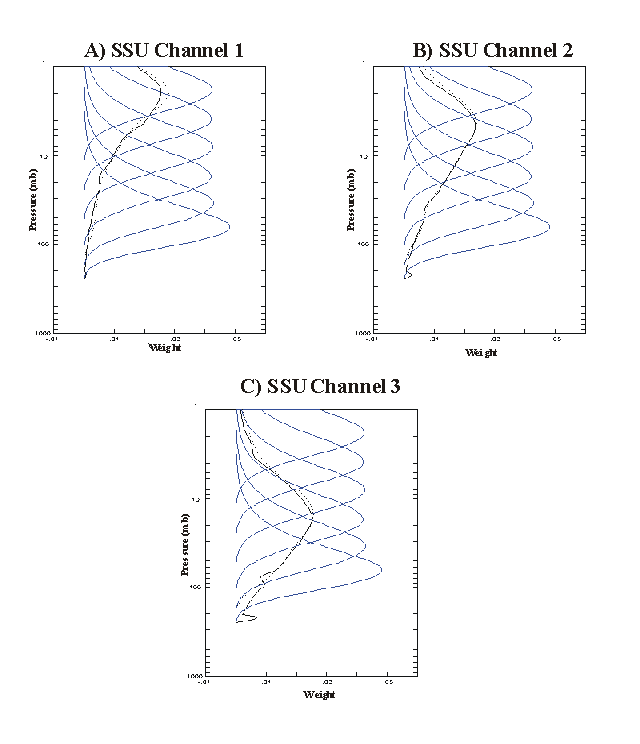
Figure 1 presents the stratospheric weighting functions of the AMSU and SSU instruments. We have simulated, by multiple regression, radiances for the 3 SSU channels from the 6 AMSU channel radiances, using a climatological collection of 1200 atmospheric temperature profiles. The SSU radiances are simulated with an RMS errors of only 0.3K. Thus, for purposes of climatological continuity, we should be able to provide, from the SSU to AMSU data, a consistent, continuous record for determinations of long-term change.
Nash and Brownscombe (1983) demonstrated that diurnal and semi-diurnal temperature variations are a source of differences in the temperatures derived from successive satellites. Temperature differences arise because of differences in the local time of observation between morning and afternoon satellites and also because afternoon NOAA satellites have precessed in their orbits. This will be rectified with the launch (expected in the year 2000) of NOAA-L, which will have a non-precessing orbit. Time of day factors affect comparisons involving CPC stratospheric analyses because the CPC analyses (Finger et al., 1993) have used both ascending and descending NOAA data. Furthermore, CPC-AMSU comparisons are affected because the equatorial crossing times of NOAA-14 and NOAA-15 are about 6 hours apart.

Figure 1. SSU channel weighting functions (solid black lines) and reconstructed SSU channel weighting functions (dashed black lines) using AMSU weighting functions (blue lines).
As an independent source of temperature information we use data from the Halogen Occultation Experiment (HALOE) from the NASA Upper Atmosphere Research Satellite (Russell et al., 1993; Hervig et al., 1996) for the period 1998 through early 1999.
Figure 2 shows the mean and RMS statistics for HALOE minus CPC temperature comparisons, as a function of pressure. Here we compare zonal average HALOE data versus the zonal average CPC data (based on SSU observations) for each day of HALOE availability, with differences averaged by month. Thus each latitude has a varying number of comparisons. Mean differences are less than 1K from 10 to 4 hPa, increasing to as much as -4K at 2 hPa. The RMS differences are about 1K at lower levels, increasing to 4K at the upper levels. We attribute the difference between the sunrise versus sunset results of HALOE minus CPC to atmospheric diurnal and semi-diurnal tidal effects.
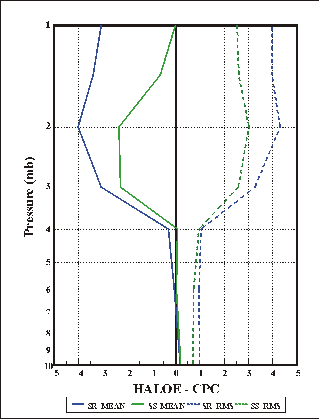
Figure 2. Zonal mean HALOE minus CPC mean and RMS temperature differences, for the calendar year 1998. The differences are shown for HALOE sunrise (SR) and sunset (SS). The latitude range corresponds to that shown in Figure 3.
In Figure 3 the above statistical differences at 2 hPa are presented as a function of latitude. Overall, HALOE is colder than the CPC results by about 3K, as also seen in Figure 2. We note that there is a tendency for differences to be larger at the equator and at higher latitudes than at mid-latitudes.
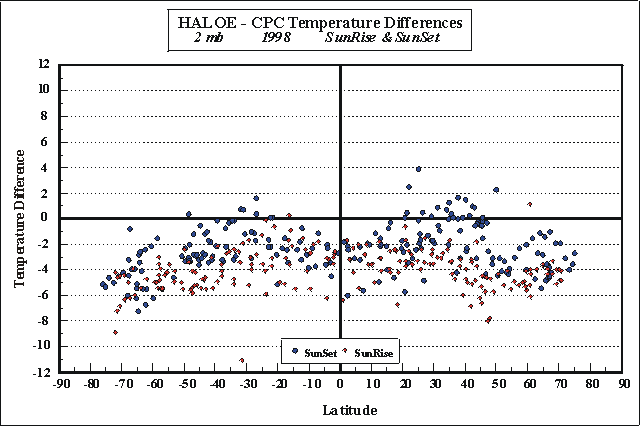
Figure 3. Daily HALOE minus CPC zonal mean temperature differences at 2 hPa, for the year 1998. The differences are shown for HALOE sunrise and sunset.
For comparisons of AMSU with HALOE data, time differences are very small. The NOAA-15 satellite has equatorial crossing times of about 7:30 am and 7:30 pm. Thus, the AMSU data are very close in time to the sunrise and sunset HALOE observations. Therefore, the impact of atmospheric diurnal and semi-diurnal variation is minimised. Figure 4 shows the HALOE-AMSU bias and RMS statistics for the period July 1998-January 1999. In contrast to the HALOE minus CPC statistics, which are based on zonal averages, the HALOE minus AMSU statistics are based on individual match-ups within 500 km. We see that HALOE-AMSU average differences are less than 1K, and RMS differences are less than 3K up to 2 hPa, increasing to about 5K at 1 hPa. The average differences are much smaller than the HALOE-CPC comparisons of Figure 2. Note that the zonal averaging process smoothes some of the variability of Figure 2. So, for comparison with Figure 2 the HALOE-AMSU RMS values in Figure 4 should be divided by about 4.
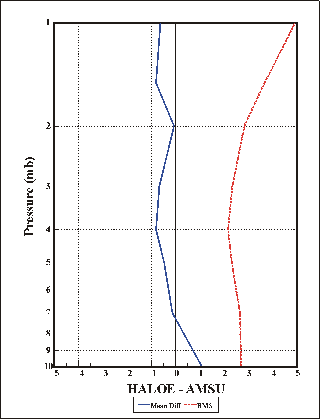
Figure 4. HALOE minus AMSU temperature differences, mean and RMS, for July 1998 to January 1999. The latitude range corresponds to that shown in Figure 5.
Figure 5 presents the 2 hPa HALOE-AMSU differences as a function of latitude. The average bias for the 2 hPa level is 0.1K, with a standard deviation of 2.8K. This standard deviation, however, includes the point-to-point variability that is averaged out in the zonal means of Figure 3. Taking this into account reduces the standard deviation to about 1K.
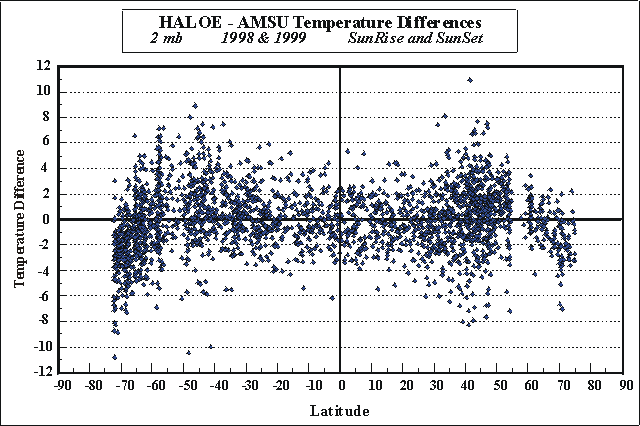
Figure 5. HALOE minus AMSU temperature differences at 2 hPa; data from July 1998 to January 1999. The larger scatter than in Figure 2 is due to use of individual observations, rather than zonal means.
Finally, Figure 6 shows time series at four stratospheric levels of zonal mean 85-90N temperatures from CPC and from AMSU. Largest differences are shown at 2 hPa, with AMSU temperatures generally lower than CPC by as much as10K in wintertime. Previous comparisons with other UARS instruments have indicated that the CPC winter polar temperatures are biased warm. This provides some reason to lend additional credence to the AMSU temperatures.
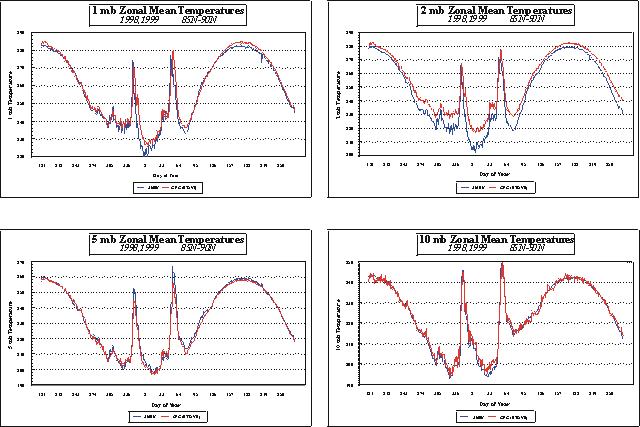
Figure 6. AMSU and CPC zonal mean 85-90N temperatures for July 1998 to January 1999, at four stratospheric levels (1, 2, 5, and 10 hPa). Note largest differences at 2 hPa during winter. Colder AMSU temperatures have better agreement with HALOE data.
We have shown that we expect significant improvement in the CPC stratospheric temperature analyses when we transition to the NESDIS temperature retrievals derived from the Advanced Microwave Sounding Unit. We expect that switch to AMSU data to occur in the CPC stratospheric analyses in early 2001. However, when the change occurs, we must determine the optimum way to transition from CPC use of the SSU data to the CPC use of the AMSU data, to ensure a consistent data set for climatological use.
Atmospheric diurnal and semi-diurnal temperature variations contribute significantly to the observed differences between satellite observations and analyses that use those satellite data. For this reason we plan to introduce two daily analyses in addition to the current 1200 UT CPC stratospheric temperature analysis which uses 12 hours of ascending and descending satellite data). The new analyses will be based on separate morning or afternoon (24 hours of ascending or descending orbital) observations. Separate morning and afternoon analyses will clarify the time-of-day factor for users of CPC stratospheric analyses, and allow better temperature comparisons with sunrise and sunset occultation experiments and with data from NOAA SBUV/2 ozone monitoring instruments.
See CPC stratospheric web site: http://www.cpc.noaa.gov.
AMSU information http://orbit-net.nesdis.noaa.gov/crad/st/amsuclimate/amsu.html.
Finger, F.G. et al., 1993: Evaluation of NMC upper-stratospheric temperature analyses using rocketsonde and lidar data, Bull. American Meteor. Soc., 74, 789-799.
Hervig, M.E. et al., 1996: Validation of temperature measurements from the Halogen Occultation Experiment, J. Geophys. Res., 101, 102777-10285.
Nash, J. and J.L. Brownscombe, 1983: Validation of the Stratospheric Sounding Unit, Adv. Space Res., 2, 59-62.
Russell, J.M. III et al., 1993: The Halogen Occultation Experiment, J. Geophys. Res., 98, 10777-10797.
Back to
| Session 1 : Stratospheric Processes and their Role in Climate | Session 2 : Stratospheric Indicators of Climate Change |
| Session 3 : Modelling and Diagnosis of Stratospheric Effects on Climate | Session 4 : UV Observations and Modelling |
| AuthorData | |
| Home Page | |