Previous: Weighting Functions Next: Final Remarks Up: Ext. Abst.
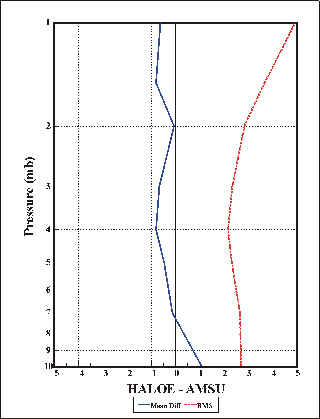
For comparisons of AMSU with HALOE data, time differences are very small. The NOAA-15 satellite has equatorial crossing times of about 7:30 am and 7:30 pm. Thus, the AMSU data are very close in time to the sunrise and sunset HALOE observations. Therefore, the impact of atmospheric diurnal and semi-diurnal variation is minimised. Figure 4 shows the HALOE-AMSU bias and RMS statistics for the period July 1998-January 1999. In contrast to the HALOE minus CPC statistics, which are based on zonal averages, the HALOE minus AMSU statistics are based on individual match-ups within 500 km. We see that HALOE-AMSU average differences are less than 1K, and RMS differences are less than 3K up to 2 hPa, increasing to about 5K at 1 hPa. The average differences are much smaller than the HALOE-CPC comparisons of Figure 2. Note that the zonal averaging process smoothes some of the variability of Figure 2. So, for comparison with Figure 2 the HALOE-AMSU RMS values in Figure 4 should be divided by about 4.

Figure 4. HALOE minus AMSU temperature differences, mean and RMS, for July 1998 to January 1999. The latitude range corresponds to that shown in Figure 5.
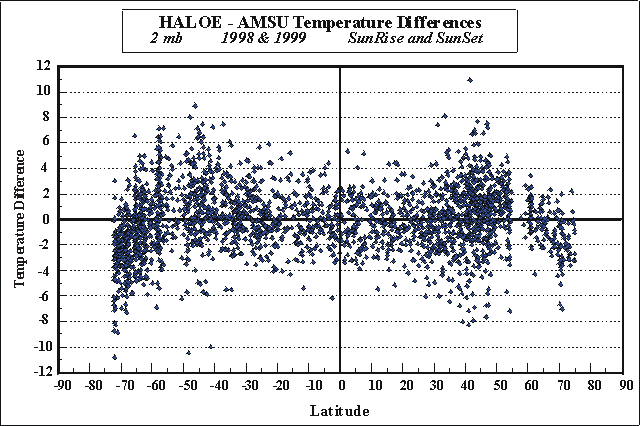
Figure 5 presents the 2 hPa HALOE-AMSU differences as a function of latitude. The average bias for the 2 hPa level is 0.1K, with a standard deviation of 2.8K. This standard deviation, however, includes the point-to-point variability that is averaged out in the zonal means of Figure 3. Taking this into account reduces the standard deviation to about 1K.

Figure 5. HALOE minus AMSU temperature differences at 2 hPa; data from July 1998 to January 1999. The larger scatter than in Figure 2 is due to use of individual observations, rather than zonal means.
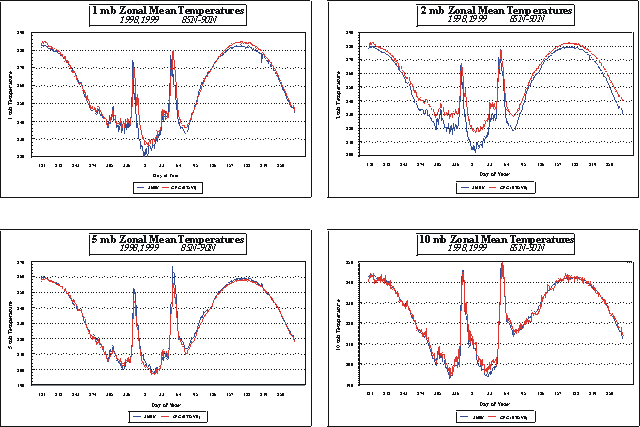
Finally, Figure 6 shows time series at four stratospheric levels of zonal mean 85-90N temperatures from CPC and from AMSU. Largest differences are shown at 2 hPa, with AMSU temperatures generally lower than CPC by as much as10K in wintertime. Previous comparisons with other UARS instruments have indicated that the CPC winter polar temperatures are biased warm. This provides some reason to lend additional credence to the AMSU temperatures.

Figure 6. AMSU and CPC zonal mean 85-90N temperatures for July 1998 to January 1999, at four stratospheric levels (1, 2, 5, and 10 hPa). Note largest differences at 2 hPa during winter. Colder AMSU temperatures have better agreement with HALOE data.