Laboratoire d'Aérologie, Toulouse, France
Laboratoire de Météorologie Dynamique, Paris, France
Abstract
1. Introduction
Transport of air across the tropopause plays an important role in determining the chemical composition, and hence radiative properties, of both the troposphere and stratosphere. Quantifying this transport presents a significant challenge on account of the many multiscale processes involved, from the global scale mean meridional circulation, through intermediate advective and convective processes, to molecular diffusion. Further, crucial to any such quantification is the ability to distinguish between reversible and irreversible motion (see Holton et al. 1995 for a general overview).
An important mechanism for cross-tropopause transport is through the quasi-horizontal motion on those isentropic surfaces that intersect the tropopause, both in middle and low latitudes. Transport can occur by strong deformations of the tropopause and the subsequent generation of fine scale structures on which molecular diffusion may operate. When viewed on an isentropic surface the tropopause is typically associated with the region of strong gradients of potential vorticity (PV), or often by a single PV value typically in the range of 1-3pvu. Transport is then associated with the irreversible generation of small-scale PV filaments, and may be estimated by the area of stratospheric PV air entrained into the tropospheric PV air or vice versa, although such estimates are notoriously sensitive on the choice of the PV value used to define the tropopause. On the other hand, more general insight may be obtained by considering the mixing properties of the flow in the upper troposphere/lower stratosphere region; these are directly linked to the generation of small scales and in some cases may also be used to define a transport.
In this work we consider some aspects of transport and mixing near the tropopause using a variety of techniques. The main tool will be the advection of material contours or particles on isentropic surfaces by observed wind fields, described in Section 2. In Section 3, we show an example of Rossby wave breaking event and the subsequent filamentation of stratospheric air into the upper tropical troposphere. In Section 4 and Section 5 we consider the seasonal and interannual variation of the mixing properties near the tropopause by two separate diagnosics, contour lengthening rates and effective diffusivity. In Section 6 we use some ideas from the theory of dynamical systems to describe the geometry of the flow field near the tropopause. A short summary is given in Section 7.
2. Methods
We use contour and particle advection on isentropic surfaces with winds derived from ECMWF analyses. The contours or particles are either initialized with the isentropic potential vorticity also derived from the analyses (Sections 3-5) or are defined in such a way as to highlight the mixing geometry of the 2-dimensional (isentropic) flow (Section 6). The horizontal resolution of the analyses is spectral T106 (or T213 in section 3), corresponding to a grid-point resolution of approximately 1.3¡ (or 0.65¡ in section 3), and the temporal resolution of the analyses is 6 hourly. The importance of the temporal resolution of the advecting winds for the accurate generation of fine scales is discussed in Waugh & Plumb (1994).
The advection model is the contour advection with surgery model of Dritschel (1989) adapted to advect both contours and particles with the imposed wind field, both forward and backward in time. The advection time-step is half an hour and the advecting winds are interpolated from the six hourly fields using cubic splines as described in Mariotti et al. (2000). Depending on the application, either a 2nd order or a 4th order Runga Kutta scheme is used for the avection.
3. Transport across the tropopause by Rossby wave breaking
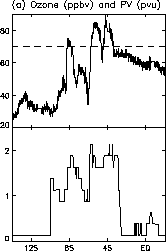
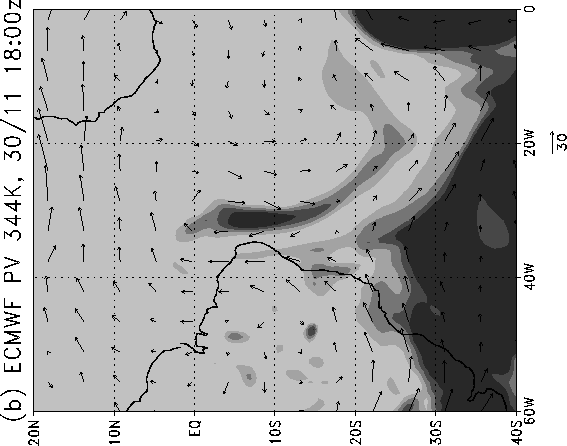
The contour advection model described above was used in standard forward advection mode to study a wave breaking event near the subtropical tropopause over the Southern Atlantic Ocean (Scott et al., 2000). The signature of this event was first observed in flight data from the MOZAIC program (Marenco et al., 1998), which showed anomalously high ozone values in the upper troposphere in a 300km width region whose dynamical properties, also from flight data, were suggestive of a local descent of the tropopause (Figure 1a). Analysed data from ECMWF (Figure 1b) showed that the high ozone values were coincident with stratospheric PV values arising from a Rossby wave breaking event resulting in a broad filament of high PV air extending equatorward as far as 3°S. This type of stratospheric intrusion is similar to those events documented more recently by Waugh & Polvani (2000), who studied Rossby wave propagation and breaking at 350K over the Pacific and Atlantic in the northern hemisphere. It is to be distinguished from those events more usually associated with low- and mid-latitude stratospheric intrusions in which a cut-of-low is frequently involved in the formation of filaments of high PV air, as studied by, eg., Appenzeller & Davies (1992) among others.
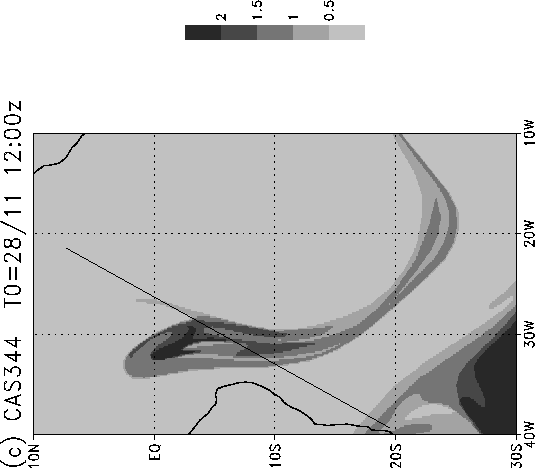
Figure 1c shows the ability of the contour advection model to generate fine scales within the filament by a calculation initialized 3 days before the time of the flight. In this calculation a surgery algorithm was applied to the contours, effectively removing scales below 20km. Such a cut-off scale is not unreasonable when considering mix-down scales in the real atmosphere, with the associated vertical scale approaching that on which molecular diffusivity can operate (Haynes & Anglade, 1997). In the case under consideration here, internal filamental structure is produced on scales of around 100km. Direct comparison with the MOZAIC data in Figure 1a shows qualitative agreement between this internal filamental structure and the finer scale structure observed in the ozone measurements (see Scott et al., 2000 for more details).


Figure 1: (a) MOZAIC flight data for 30/11/1995 (top panel) and PV along the flight trajectory from a contour advection simulation on nearby isentropic surface (see Figure 1c); (b) ECMWF analysed PV at the time of the flight; (c) PV at the time of the flight from a contour advection simulation initialized three days previously. The line in (c) represents the flight trajectory.
4. Stretching rates
One possible measure of the mixing propertes of a given atmospheric flow is the stretching rates of materially advected contours, related to the Liapunov exponents of the flow (eg. Ottino 1989) and essentially the rate at which fine scales are produced on which molecular diffusivity may operate. On isentropic surfaces a suitable choice of material contour are isolines of potential vorticity. Further, considering the tropopause as a transport barrier suggests the possibility of identifying it with a PV contour that exhibits a minimum stretching rate. Bithel & Gray (1997) considered stretching rates for a six day period in October 1990, using contours initialized with a range of PV values, but found no single value of PV that yielded a minimum stretching rate, and that could therefore be identified with the tropopause.
Here, we reexamine the contour stretching rates near the tropopause, but this time focus on broader scale patterns and their seasonal and interannual variability. We performed a series of integrations (with no surgery) over a 5 year period from 1995 to 1999, with three integrations per month, and on each of the isentropic surfaces 330K, 350K, 370K. The contours were initialized with PV from ECMWF analyses taking values of (±) 0.6, 1.6, 2.6, 3.6, 4.6, 5.6 pvu. Each integration lasted 6 days, which was found to be sufficient to define a stretching rate. Figure 2 shows the stretching rates of each simulation, plotted as a function of initial time, after smoothing with a boxcar of width 70 days (or 7 integrations). Unsmoothed results (not shown) revealed considerable short term (10 day) variability, consistent with the time-scale of baroclinic lifecycles or Rossby wave breaking events.
Several features of Figure 2 are worth noting. First there is a clear annual signal at all levels, with stronger mixing in the summer and weaker mixing in the winter, in accordance with our current understanding of the seasonality of the tropopause (eg. Appenzeller et al., 1996), as well as with more specific recent studies of, eg. effective diffusivity (Haynes & Shuckburgh, 2000). Although this annual signal is in general weaker at 370K, it is still visible there, especially in the higher PV contours of ((±)) 3.6, 4.6, 5.6 pvu. Note also that the 0.6 and 1.6 pvu contours at 370K in the NH show an annual cycle that is in antiphase with the higher PV contours, ie with mixing strongest in winter, weakest in summer.
Another important feature of Figure 2 is the difference in stretching rates between different PV contours at a particular time. For example, at 350K in both hemispheres there is a wider range of stretching rates in the winter than in the summer. Thus, considering the tropopause as a dynamical barrier to mixing, the stretching rates in the winter portions of Figure 2b,e, suggest identifying the tropopause with 1.6, 2.6 or 3.6 pvu contours, eg 2.6-3.6 in the SH 1995 and 1996 winters, or 1.6-2.6 in the NH winters. Similarly such arguments suggest a strong seasonality of the tropopause at 370K, varying over the full range of PV contours used here, from 5.6 pvu in the winter to 0.6 pvu in the summer.
Considering interhemispheric differences in general, we note that that stretching rates are higher in the NH than in the SH, most notably at 330K and 350K. This is consistent with the generally more disturbed troposphere in the NH, associated with the stronger topography and land-sea temperature contrasts.
Finally, although the time-series is too short to infer any long term trends, Figure 2 gives some suggestions of the interannual variability. For example, the NH winter at the beginning of 1998, following a strong El Nino event, is markedly more stable at all levels than the surrounding winters, while both the NH and SH winters of 1995 is less stable, most notably at 350K and 370K. Further calculations extending the time-series backwards are necessary to identify any possible relation between the stability of the tropopause region and, eg., the phase of ENSO.

Figure 2: Contour lengthening rates the 330K, 350K and 370K isentropic surfaces in each hemisphere, in units of 1/day.
5. Effective diffusivity
An alternative diagnostic for measuring the mixing properties of a flow is the effective diffusivity, as described in Winters & D'Asaro (1996) and Nakamura (1996), and applied to atmospheric problems in Nakamura & Ma (1997), Haynes & Shuckberg (2000a,b). The effective diffusivity has the advantage over the contour stretching rates described above of being a hybrid Eulerian-Lagrangian quantity that therefore avoids the problems encountered by purely Lagrangian techniques near relatively weak barrier regions. The effective diffusivity of a scalar field is proportional to the square of the equivalent length, Le, of a contour enclosing the region where the scalar field is greater than a given value [see eg. Nakamura (1996) for details and definitions]. The equivalent length is in turn related to the actual material length, L, of the contour by the inequality Le £,L with equality when the gradient of the tracer field is uniform (in magnitude) around the contour.
To compute L we use again the contour advection model, but this time include the surgery algorithm. This removes those scales below a certain threshold (in this case 20km) with the result that the contour lengths equilibriate after a few days, the generation of new fine-scale structures balancing the removal of others by the surgery. We then use the resulting contour length, normalized by the length of the equivalent latitude contour, as an approximation for the equivalent length Le.
The results of five years of simulations, one six day simulation per month on the 350K isentropic surface, with twenty contour intervals per hemisphere spanning the PV values from (±) 0.4 to 8.4 pvu, are shown in Figure 3. Here, Le is plotted as a function of equivalent latitude and time. The darker shades represent low values of Le, and hence with areas of low effective diffusivity and low mixing rates. Both the seasonal variability and the interhemispheric differences are clearly visible. The former includes both the intensification of the tropopause as a mixing barrier in winter (cf Figure 2, identified by the darker shades, as well as the poleward migration in the late summer (cf Haynes & Shuckburgh, 2000, who found a similar pattern in the effective diffusivity calculated from particle integrations). The interhemispheric differences are characterized by weaker overall mixing rates in the SH (darker shades, corresponding to lower Le) as well as a less well defined latitudinal migration of the tropopause with the annual cycle. This latter feature is consistent with the different characteristics of baroclinic activity between the two hemispheres. Finally, we note that similar interannual variability is seen in Le as was seen in the stretching rates above, most notably lower values of Le in the 1998 NH winter and higher values of Le in the 1995 NH and SH winters.

Figure 3: Equivalent length of isocontours of PV, plotted as a function of equivalent latitude and time in the NH (top) and SH (bottom).
6. Geometric properties
We next consider how certain recent ideas from the theory of dynamical systems may be applied to the observed velocity fields in the region of the tropopause. We focus on the location of certain geometric structures, in particular the invariant (stable and unstable) manifolds and uniform hyperbolic trajectories. Recent extensions of the theory of time periodic flows to aperiodic flows, as well as new methods and algorithms for extracting the geometric structures can be found in Malhorota & Wiggins (1998), Haller (2000), Lapeyre et al. (2000), where the reader is also directed for further details and definitions. Recent applications of some of these and other ideas to problems of mixing in geophysical flows can be foud in, eg., Haller & Poje (1998), Bowman (2000), Binson & Legras (2000).
Figure 4a shows the stable and unstable manifolds calculated by the finite strain method described in Bowman (2000) and Joseph & Legras (2000), which involves advecting a grid of particles and a pertrubed grid for a finite time both forwards and backwards in time and noting the pairs of initial conditions that reach a given separation (here 50 time the initial separation). The green shading in the figure represents those particles that separate forward in time (mapped back to their initial locations), thus representing the global stable manifolds. Similarly the red shading represents the global unstable manifolds. Consideration of the PV field at this time, Figure 4b, shows the manifolds to align predominantly along the equatorward flank of the high PV gradients of the tropopause. Further, suggestions of local hyperbolic regions, indicated by the transverse intersections of the stable and unstable manifolds can be seen equatorward of Rossby wave undulations reaching breaking amplitudes.
In an attempt to refine the local picture of manifold intersections, we implemented the Jacobain method of Haller (2000) for locating uniform hyperbolic trajectories, and then used the straddling technique of Miller et al. (1996) to contruct the local invariant manifolds with contour advection (see also Koh & Plumb, 2000). Because of the short persistence times of the geometric structures, the manifolds in general cannot be extended to the point of showing any lobe structure (Figure 4c). However, in the region of largest tropopause deformation, near O¡E, there is a uniform hyperbolic trajectory located on the poleward side of the tropopause, consistent with the picture of strongly supercritical wave breaking discussed in Polvani & Plumb (1992). Here we see the suggestion of a heteroclinic tangle and the associated lobe structure.


Figure 4: Flow properties at 350K on 15/2/1998: (a) stable (green) and unstable (red) manifolds calculated by the finite strain method; (b) ECMWF analysed PV; (c) uniform hyperbolic trajectories (blue) and their local manifolds calculated by the Jacobian method, and the extended manifolds calculated by straddling.
7. Conclusions
Some Lagrangian techniques have been applied to isentropic flow near the tropopause to help identify some large scale flow features as well as the seasonal and interannual variability of the tropopause as a transport barrier. Both contour stretching rates and effective diffusivity diagnostics show seasonal and interhemispheric variability that is consistent with our current perception of the upper troposphere/lower stratosphere. In addition, they suggest considerable seasonal variability of the PV value best suited to defining the tropopause. Finally, although the time period of 5 years is not enough to show any clear pattern, the results hint at interannual variability that may be linked with the phase of ENSO.
Geometric aspects of the isentropic flow have also been considered. Consistent with Koh & Plumb (2000) and Joseph & Legras (2000), the uniform hyperbolic trajectories, and the associated kinematic barrier defined by the local manifolds, lie in a stochastic layer equatorward of the dynamical barrier associated with the tropopause. Thus, transport deduced from lobe dynamical considerations will not necessarily be the most relevant to cross-tropopause transport. It is anticipated that a more detailed investigation of the persistence time of the geometric structures and of the width of the stochastic layer will help clarify the problem of transport across such dynamical barriers.
References
| Session 1 : Stratospheric Processes and their Role in Climate | Session 2 : Stratospheric Indicators of Climate Change |
| Session 3 : Modelling and Diagnosis of Stratospheric Effects on Climate | Session 4 : UV Observations and Modelling |
| AuthorData | |
| Home Page | |