Previous: Methods Next: Stretching rates Up: Ext. Abst.
3. Transport across the tropopause by Rossby wave breaking
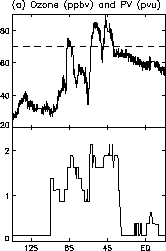
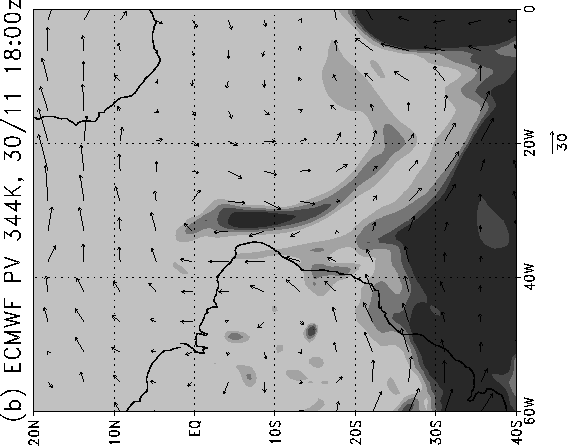
The contour advection model described above was used in standard forward advection mode to study a wave breaking event near the subtropical tropopause over the Southern Atlantic Ocean (Scott et al., 2000). The signature of this event was first observed in flight data from the MOZAIC program (Marenco et al., 1998), which showed anomalously high ozone values in the upper troposphere in a 300km width region whose dynamical properties, also from flight data, were suggestive of a local descent of the tropopause (Figure 1a). Analysed data from ECMWF (Figure 1b) showed that the high ozone values were coincident with stratospheric PV values arising from a Rossby wave breaking event resulting in a broad filament of high PV air extending equatorward as far as 3°S. This type of stratospheric intrusion is similar to those events documented more recently by Waugh & Polvani (2000), who studied Rossby wave propagation and breaking at 350K over the Pacific and Atlantic in the northern hemisphere. It is to be distinguished from those events more usually associated with low- and mid-latitude stratospheric intrusions in which a cut-of-low is frequently involved in the formation of filaments of high PV air, as studied by, eg., Appenzeller & Davies (1992) among others.
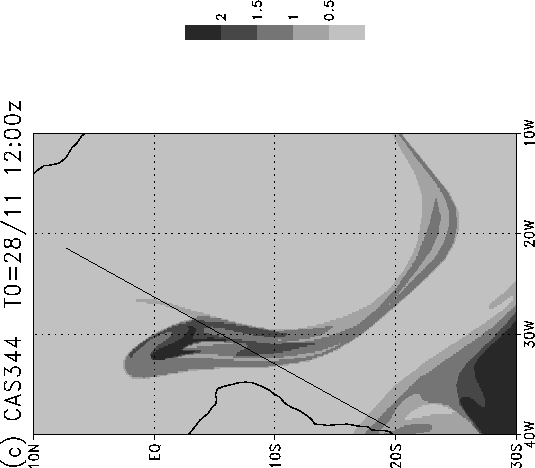
Figure 1c shows the ability of the contour advection model to generate fine scales within the filament by a calculation initialized 3 days before the time of the flight. In this calculation a surgery algorithm was applied to the contours, effectively removing scales below 20km. Such a cut-off scale is not unreasonable when considering mix-down scales in the real atmosphere, with the associated vertical scale approaching that on which molecular diffusivity can operate (Haynes & Anglade, 1997). In the case under consideration here, internal filamental structure is produced on scales of around 100km. Direct comparison with the MOZAIC data in Figure 1a shows qualitative agreement between this internal filamental structure and the finer scale structure observed in the ozone measurements (see Scott et al., 2000 for more details).


Figure 1: (a) MOZAIC flight data for 30/11/1995 (top panel) and PV along the flight trajectory from a contour advection simulation on nearby isentropic surface (see Figure 1c); (b) ECMWF analysed PV at the time of the flight; (c) PV at the time of the flight from a contour advection simulation initialized three days previously. The line in (c) represents the flight trajectory.
Previous: Methods Next: Stretching rates Up: Ext. Abst.