 |
Stratospheric Processes And their Role in Climate
|
||||||||
| Home | Initiatives | Organisation | Publications | Meetings | Acronyms and Abbreviations | Useful Links |
![]()
|
Stratospheric Processes And their Role in Climate
|
||||||||
| Home | Initiatives | Organisation | Publications | Meetings | Acronyms and Abbreviations | Useful Links |
![]()
A wide variety of statistical models have been used to derive trends in stratospheric ozone and to determine the effects on ozone of other variables such as the solar cycle and the quasi-biennial oscillation (QBO). The 1989 Scientific Assessment of Ozone Depletion (WMO, 1990, Chapter 2) contained brief intercomparison results of a few of these statistical models. It was found that variations in the statistical model or in the ancillary variables used (solar, QBO, nuclear effect) had relatively minor effects on the calculated ozone trend, at least for total ozone. However, when different research groups derive different trends, questions continue to arise as to how much of the difference in the trends or standard errors is due to differences in data used, and how much is due to the differences in the statistical model calculations.
The purpose of this section is to compare the statistical trend calculations of participating research groups on common sets of ozone data in order to determine the effect on ozone trends of statistical model differences.
The following sections describe the three test data series used for the intercomparisons; illustrate the statistical model issues using the example of one particular statistical model; and discuss the differences in results of the contributing participants.
Three sample ozone data sets were chosen to represent some of the issues involved in fitting a statistical model. The data are plotted in Figure 3.1 a,b,c.
Test data 1 (TOMS) is a "clean" time series, with no missing values. Test data 2 (Uccle sondes) has stretches of missing values, including one of fifteen months in the middle of the series. Test data 3 (SAGE) has serious missing-data issues, especially for the early years of the series, including a break of almost three years between the SAGE I and SAGE II data; also there are no June values until 1990, causing additional issues for monthly trend models.
Ancillary time series of related variables are also frequently included in trend models, either from interest in the effect on ozone of the ancillary variables themselves, or in hopes of improving the ozone trend estimate by removing the effect of the other variables. The two effects most commonly included are the 11-year solar cycle and the quasi-biennial oscillation (QBO) in equatorial stratospheric winds. The latter is frequently lagged by several months with lag depending on latitude and altitude. Different researchers use different proxies for these effects. For solar effects, the 10.7 cm (2800 MHz) solar radio flux or sunspot number are typical choices, while 50 hPa or 30 hPa equatorial winds are frequently chosen for the QBO. For reference and verification purposes, the 10.7 cm flux and a QBO series (average 50 hPa wind at three stations) are available.
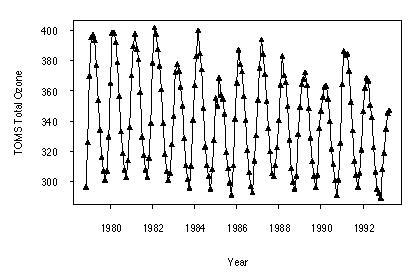
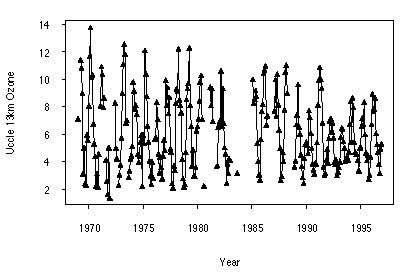
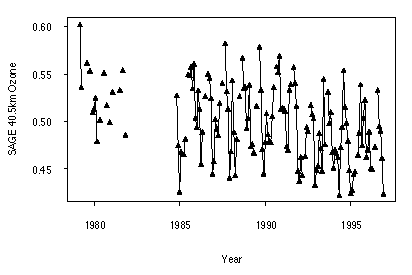
Figure 3.1 a) Test Data 1 - TOMS monthly average total ozone 11/78-4/93, 40°N-50°N, in Dobson Units. b) Test Data 2 - Uccle 13 km sonde monthly average ozone 01/69- 12/96, in mPa. c) Test Data 3 - SAGE I/II 40.5 km monthly average ozone, 03/79 -12/96, 35°N-45°N, in 1012 cm-3.
This section summarises one form of statistical model as a context for discussion of the statistical issues in the intercomparison of models. For some additional discussion of the terms and statistical issues, see Bojkov et al. (1990).
Let ![]() represent monthly ozone values for one of the test series; in
some cases
represent monthly ozone values for one of the test series; in
some cases ![]() is missing for some months, and this is addressed in the notes
below. The statistical model for
is missing for some months, and this is addressed in the notes
below. The statistical model for ![]() is of the form:
is of the form:
![]() = (Monthly mean) + (Monthly trend) +
(Solar effect) + (QBO effect)
+ Noise
= (Monthly mean) + (Monthly trend) +
(Solar effect) + (QBO effect)
+ Noise
or more precisely,
![]()
with the definitions:
|
|
Ozone mean in month i, i = 1…12 |
|
|
Indicator series for month i of the year; i.e., 1 if the month corresponds to month i of the year, and 0 otherwise |
|
|
Trend in Dobson units/year in month i of the year |
|
|
Linear ramp function measuring years from the first month of the series; equal to (t-to)/12. For series beginning before 1970, it is often taken to be a ramp function equal to zero for t < to, where to corresponds to 12/69, and then (t-to)/12 for t ? to. |
|
|
Solar 10.7 cm flux series, with g 1 the associated coefficient |
|
|
QBO series lagged some appropriate number of months (latitude and altitude dependent), with g 2 the associated coefficient |
|
|
Residual noise series |
Although this is the underlying model used by most researchers, a variety of statistical model issues are handled differently by different researchers, or even by the same researcher depending upon data features, for example if the proportion of missing data is very high. The following notes illustrate some of the frequent differences, but are not intended to be exhaustive, especially on minor issues.
Ozone trends are sometimes reported (usually graphically) on a monthly basis, but it has become common to tabulate the trends on an aggregated seasonal basis. Common seasons are Dec...Feb, Mar...May, Jun...Aug, Sep...Nov plus year round, but others have been used (for example Dec...Mar, Apr, May...Jul, Sep...Nov). To calculate seasonal trends from a monthly model, one averages the monthly trends over the months in each season. If percentage trends are desired, some groups calculate these from the average ozone trends in each season divided by the average ozone intercept (mi) for the months in that season; other groups divide by the mean value for that season over the period of the time series (also, occasionally averages of monthly percentage trends have been calculated).
Proper calculation of the standard errors of seasonal trends when a monthly model is used requires use of the covariance matrix of the trend estimates. This is particularly important when an autocorrelated noise model is used, and if disregarded, may lead to serious underestimates of the standard errors of seasonal trends because the average of, for example, Dec-Jan-Feb trend estimates, does not represent the average of three independent quantities.
Sometimes the seasonal model is fit with only four seasons by explicitly working with quarterly data (using Q1=Dec...Feb, etc.). A variation on this when data is sparse is to fit 12 monthly means, but only quarterly trends. In this case the standard errors are handled automatically, except for the year round trend. This approach has been used for deriving trends from sonde data (Miller et al., 1995).
Sometimes too, the seasonal mean and/or the seasonal trends will be treated as the sum of sine and cosine harmonics, with the higher order terms dropped if not statistically significant. This is almost necessary if one models daily or weekly data, and has also been used to reduce the number of terms in the model when the solar or QBO terms are treated on a seasonal basis.
Seasonal trends can also be calculated by fitting multiple regression models separately for each month or for each season, using time and ancillary variables as predictors. This automatically handles seasonal weighting, but allows the solar and QBO coefficients to be different in each month or season. If done by season (quarterly ozone values), this approach automatically handles the autocorrelation issue for the standard error for the seasonal trend. It does not provide the necessary covariance matrix for the standard error of a year round trend. It may cause problems when data is consistently missing for a specific month.
For many ozone series, especially total, the noise term Nt is autocorrelated, i.e. Nt plotted against Nt-1 will show a substantial correlation. This is due to dynamic or other effects not explicitly accounted for in the statistical model. This has usually been accounted for by allowing Nt to be an autoregressive series of order 1, i.e., AR(1) model, (although occasionally higher order autoregressive series have been used):
Nt = fNt-1 + et
where et is an uncorrelated series.
Properly accounting for an autocorrelated noise series normally changes the trend estimates by little, but leads to larger standard errors of the trend estimates than ordinary least squares. This is particularly important for seasonal and year round trend estimates produced by averaging monthly estimates, as discussed above.
Computations for fitting regression models with autocorrelated errors usually follow a conditional least squares approach (conditional on the first observation in the case of an AR(1) model) or, preferably, unconditional least squares or maximum likelihood (see, for example, Box et al., 1994). These calculations are programmed into some statistical packages, although not all can well handle internal missing data values. Some researchers use their own FORTRAN routines to perform maximum likelihood calculations.
Some researchers use ordinary least squares estimates for trend calculations, but use a bootstrap (resampling) technique to calculate the standard errors (e.g. Efron and Tibshirani, 1993). The use of seasonal segments in such resampling techniques allows for proper handling of autocorrelation and seasonal weighting in the regressions. This has been found to lead to similar standard errors as the explicit autoregressive model.
The jack-knife technique (Miller, 1974) is also used in cases where data are missing in the time series. In this approach, consecutive blocks of data are dropped from the time series instead of resampling the data. The variability of the parameters with each run gives an overall error estimate for each model term.
For data series beginning after 1970, the trend term, Rt, is taken to be a linear function of time, with the zero point normally the first available data point. For series which extend back into the 1960's or earlier, a "hockey stick" trend has commonly been used: a ramp function which is zero up to (usually) 12/69, and then linear with time thereafter. This was originally designed to approximate expected ozone depletion from emissions of CFCs. In the 1994 Ozone Assessment (WMO, 1995), the data before 1980 was allowed to have a trend independent of that after 1980. This "double jointed hockey stick" was used to estimate differences in trends in the 1970’s vs. the 1980’s. It is also possible to use the predicted effect of chlorine driven depletion from photochemical models, although this has the disadvantage of changing as the chemical models are improved.
A few researchers continue to use 12/69 as the zero point for the trend term Rt which begin later (e.g., TOMS in 11/78). This does not affect estimated trends in ozone, but does affect the intercepts, m i, and therefore also affects percentage trends for those researchers who use the intercepts, rather than the monthly or seasonal mean, as the base for percentage trends. These differences are usually small unless the trends themselves are large.
Ozone is more variable in the winter than in the summer, and application of monthly or seasonal weights in the regression analysis accounts for this. This will have the effect of increasing the standard errors of the ozone trend estimates for the high variability months, while decreasing them for the low variability months, compared to an ordinary unweighted analysis. Initial weights are usually chosen inversely proportional to individual monthly ozone variances, and then updated from the residuals of an initial regression fit. This can be iterated to convergence if desired, although using only one or two iterations leads to essentially the same results.
When auto-regressive models are fit, the monthly or seasonal weights can be applied to the noise Nt series or the uncorrelated et series with nearly identical results, and the choice is reasonably made based on computational convenience.
Participating researchers were asked to perform trend calculations on the three test data sets and report the results for the intercomparison, together with notes on their models. Trend results were requested by season (Dec-Jan-Feb, Mar-Apr-May, Jun-Jul-Aug, and Sep-Oct-Nov) as well as Year Round. Trends were requested in natural units per year (e.g., DU/year for total ozone) and %/decade (with respect to the mean of the slope period, or noted otherwise).
Ten researchers (or research groups) responded with at least some test analyses:
|
Bishop:
|
Allied Signal |
|
Fioletov:
|
Atmospheric Environmental Services, Canada |
|
Hollandsworth and Flynn:
|
NASA/GSFC |
|
Logan and Megretskaia:
|
Harvard Univ. |
|
McCormack and Hood:
|
Univ. Arizona |
|
Newchurch and Yang:
|
Univ. Alabama/Huntsville |
|
Randel:
|
NCAR |
|
Reinsel:
|
Univ. Wisconsin/Madison (same model as Tiao et al./ Univ. of Chicago) |
|
Wang and Cunnold:
|
Hampton Univ. /Georgia Tech |
|
Ziemke and Chandra:
|
NASA/GSFC |
Figures 3.2, 3.3, and 3.4 show the trend results in natural units together with one standard error uncertainties.
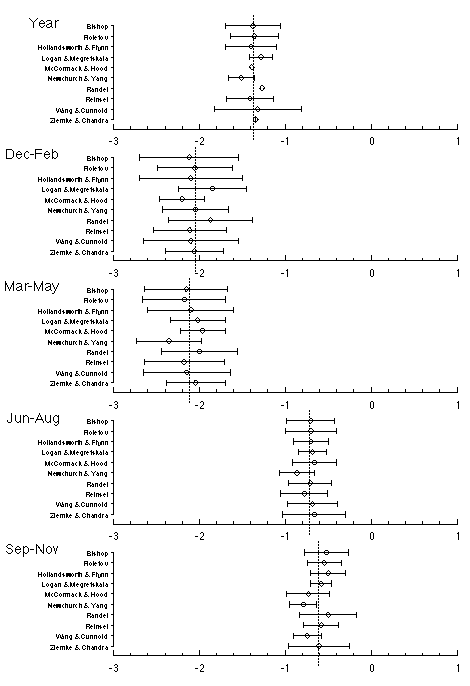
Figure 3.2 Ozone trend estimates by researcher for Test Set 1, TOMS monthly total ozone 11/78-4/93, 40°N-50°N. Trends are in DU/year. Uncertainty intervals are one standard error. Year round trends (average over all months) were calculated where possible if not given directly by the researcher, but in some cases not enough information was given to calculate the corresponding standard error. Vertical dotted line is the mean of all researchers' trend estimates.
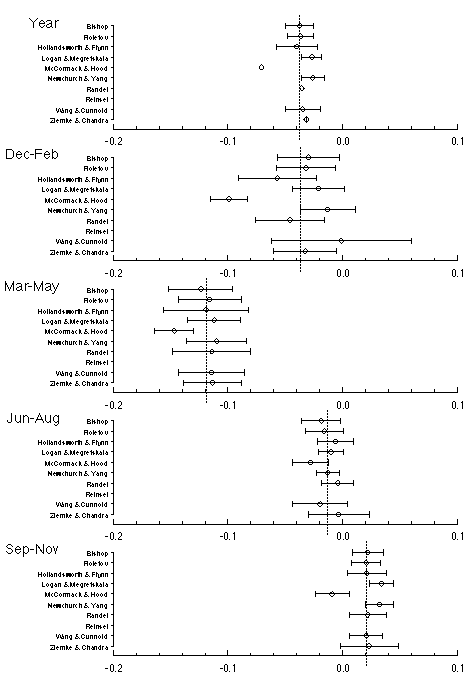
Figure 3.3 Ozone trend estimates by researcher for Test Set 2, Uccle sonde 13 km ozone 01/69-12/96. Trends are in mPa/year. Uncertainty intervals are one standard error. Year round trends (average over all months) were calculated where possible if not given directly by the researcher, but in some cases not enough information was given to calculate the corresponding standard error. Vertical dotted line is the mean of all researchers' trend estimates.
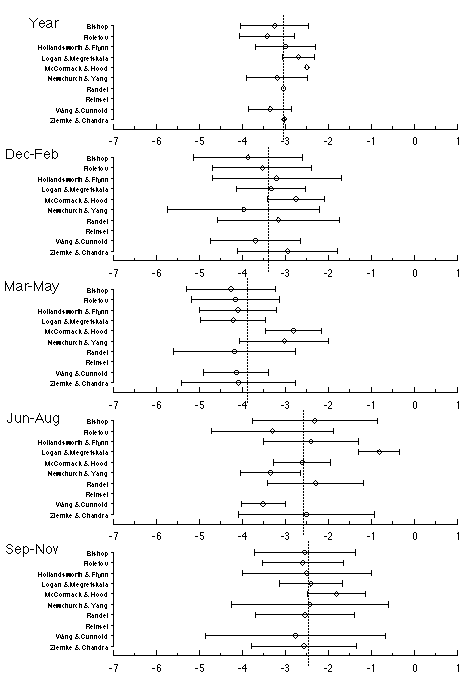
Figure 3.4 Ozone trend estimates by researcher for Test Set 3, SAGE I and II 40.5 km ozone 11/78-4/93, 35°N-45°N. Trends are in 109 cm-3/year. Uncertainty intervals are one standard error. Year round trends (average over all months) were calculated where possible if not given directly by the researcher, but in some cases not enough information was given to calculate the corresponding standard error. Vertical dotted line is the mean of all researchers' trend estimates.
The ten sets of trend estimates are very similar in the case of the TOMS test data set, although standard errors vary noticeably, particularly for the case of the year round trend (average of all months or seasons). In all but one case, the mean estimate over all researchers is contained within the one standard error estimate of each researcher, and in every case within two standard errors. The TOMS test data is different from the others in that there are no missing data, and it is likely that this feature has led to the greater degree of consistency than is found in the Uccle and SAGE results. The primary differences among researchers’ results on the TOMS data set are found in the standard errors:
· Researchers with seasonal weighting obtain estimates with larger standard errors in the winter and spring, and smaller standard errors in the summer and fall.
· Researchers using autoregressive models quote larger standard errors than those who don't, particularly for the year round trend (when available). See discussion on the example model earlier in this section.
Most, but not all, researchers obtained consistent results. McCormack and Hood calculated trend estimates substantially lower (more negative, or less positive) than the others for unknown reasons. This was especially noticeable in the winter and fall seasons. Wang and Cunnold reported a standard error for the Dec-Jan-Feb trend estimate twice as large as the other researchers ? although this is the most variable season for ozone, several other researchers also include seasonal weighting in their model. Their estimate was also much larger, though the one standard error uncertainty interval still included the mean of all researchers, since the interval was so large. Other than these two discrepancies, the primary differences were as discussed for TOMS above, in the seasonality and size of the standard errors.
For seasons other than the summer (Jun-Jul-Aug), most researchers obtained reasonable consistency for both trend and standard errors (other than the size and seasonality variations due to autoregression and seasonal weighting model differences). Possible exceptions were McCormack/Hood and Newchurch/Yang in Mar-Apr-May, whose estimates were larger than the others.
The SAGE data pose a particular problem in regard to missing data, with the very irregular presence of data for SAGE I, followed by a break, and then specific patterns of missing data for SAGE II. As an example, there are no values for June until 1990, and August values are missing from 1986 through 1993 inclusive. A researcher who calculates monthly trends and averages these into seasonal trends will obtain a different summer trend than one who computes seasonal trends directly, either through a seasonal model using monthly data or, especially, one based on seasonal mean ozone where one must either estimate the missing June and August values, or discard the May-Jun-Jul season ozone altogether if any one month is missing.
The summer estimates (Jun-Jul-Aug) for SAGE I/II pose special problems as discussed above. There is a peculiar pattern of missing data in these months, and the researchers' decisions as to how to handle this appear to have led to substantial differences in trends and standard errors. The average estimate was about -2.5¥109/year, with all researchers between -2 and -3.5 except for Logan and Megretskaia at -0.8. Logan and Megretskaia also quoted an unusually small standard error of 0.5. Even for the group of researchers who obtained fairly similar estimates for the summer, the quoted standard errors varied by a factor of three. When fitting their monthly model, Newchurch and Yang obtained a very large negative trend estimate in the summer season with an extremely large standard error, and they suggested use of their seasonal model (based on seasonal ozone averages) to maintain stability; their seasonal results are those shown in the figure. They believe the summer instability in the monthly model is attributable to use of a separate AR(1) coefficient in each month ? their method of calculation leads to the loss of data for both neighbouring months whenever either is missing, and this results in little data for fitting the summer AR(1) coefficients and trends.
One important question is how the inclusion or neglect of the solar, QBO and other terms in the statistical models influences the derived trend and standard error estimates (i.e. how sensitive are the trend results to details of other model terms?). In order to examine this, the test time series were analysed using models with only a linear trend component. Comparison to the 'full' model trend results showed relatively small (~10%) changes in values of the trends. For the TOMS test data the trend standard errors were increased somewhat (by up to 20%) by neglect of the other components. On the other hand, the trend standard errors for the Uccle and SAGE test data were slightly reduced by use of the simpler model. Detailed changes in standard error would likely be sensitive to location (such as at the equator, where the QBO component is relatively important). However, the overall conclusion is that the trend results are relatively insensitive to inclusion of other terms in the statistical models. This is probably due to the fact that the time series are sufficiently long compared to the 11-year solar cycle and ~2 year QBO periodicities. A similar insensitivity of trend results is found concerning the inclusion or neglect of data during the El Chichon and/or Mount Pinatubo time periods (for data through 1996, as used throughout much of this report). The episodic influence of volcanic events will only have a strong effect on trends if they occur at either extreme end of the time series.
· On the test data with no missing monthly values (TOMS), all researchers obtained similar results for trends. There were variations in standard errors, however, which were large enough to give some concern, as they affect the statistical significance of the trends. For example, long-term total ozone trends near the equator border on statistical significance (WMO, 1995) - lack of proper calculation of standard errors in such a situation may result in non-significant trends being declared statistically significant, or vice versa.
· For the test data sets with missing values, particularly the SAGE set with large numbers of missing values in a strong pattern form, some researchers’ results deviated substantially from the average, both with respect to trend estimate and, especially, standard error. Some researchers feel that in such situations, it is better to fit a simpler model to maintain stability; for example, by fitting seasonal trends directly or by use of reduced numbers of harmonic terms for the seasonal trends and possibly also the seasonal cycle.
· Based on these intercomparisons, it is important that researchers provide good documentation for the features of their statistical model. Particularly, when any patterns of missing data exist which have strong time dependent features, the methods of handling the missing data should be discussed in detail.
![]()