 |
Stratospheric Processes And their Role in Climate
|
||||||||
| Home | Initiatives | Organisation | Publications | Meetings | Acronyms and Abbreviations | Useful Links |
![]()
 |
Stratospheric Processes And their Role in Climate
|
||||||||
| Home | Initiatives | Organisation | Publications | Meetings | Acronyms and Abbreviations | Useful Links |
![]()
In section 2.4.3 the comparison of Umkehr data with SAGE II data was described. Here we compare data from 8 of the 13 stations used there with data from the Nimbus 7 SBUV instrument. SBUV (the solar backscatter ultraviolet instrument) operated from November of 1978 until June of 1990 when the instrument failed. Details of the SBUV calibration and algorithm are described in Chapter 1. The comparison of SBUV with Umkehr is of interest because the two techniques are very similar. The altitude in the atmosphere at which the scattering contribution function peaks depends on the product of the ozone cross section times the optical path. SBUV measures an ozone profile by scanning through wavelength (varying cross section) while Umkehr does so by measuring over a range of solar zenith angles (varying optical path). The information content and vertical resolution of the two techniques are similar. SBUV is considered to have good information in Umkehr layers 9 through 6 (and possibly 5) while Umkehr is considered to have good information in layers 8 through 5 (and possibly 4). SBUV is much less sensitive to volcanic aerosol effects than Umkehr because it views from above, and most of the aerosol is below most of the ozone.
The SBUV data used in this comparison were produced with the version 6 algorithm described in Chapter 1. Until 1983 SBUV was on a three-day-on one-day-off schedule because of spacecraft power limitations; after that it operated full time. In February 1987 the instrument began to experience a high rate of chopper synchronisation errors, which caused an apparently random error of ~3% in the radiance measurements. A correction was applied [Gleason et al., 1995] and the post-1987 data do not appear to have a bias. Recent comparisons with NOAA-11 SBUV/2 data suggest increasing calibration error in the last year of data (the instrument failed in June of 1990). Since SBUV is a nadir-only measurement on a polar orbiting spacecraft, on a given day the SBUV orbital track could be as much as 13o away in longitude from the Umkehr site. We use SBUV data interpolated to each Umkehr station using a distance-weighted average of observations within 2o of latitude and 15o of longitude.
The Umkehr data used were described in section 2.4.3. They were corrected for volcanic effects using the Mateer aerosol correction described in that section. Both Umkehr and SBUV processing used the Bass and Paur ozone cross section data and should be consistent in that respect. When both sunrise and sunset Umkehr observations are available, the two observations are averaged rather than being treated as independent observations. Data from 8 stations (Table 2-12) with what appear to be consistent data records were used in this comparison. Data for individual Umkehr layers 4 through 8, for combined layers 1+2+3+4 and for layers 8+9+10 combined are compared.
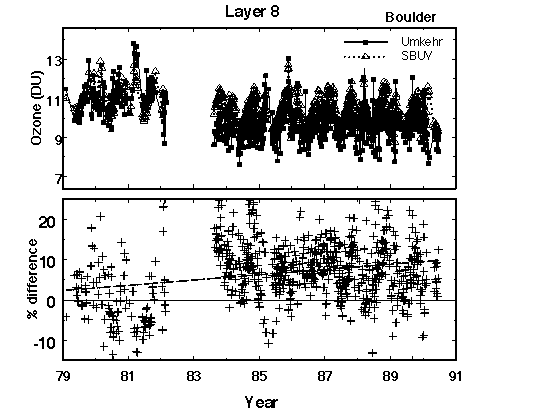
To illustrate some of the limitations of analysing the SBUV versus Umkehr comparisons, the time series for one station, Boulder, Colorado, is shown in Figure 2-48. The matched time series of Umkehr observations (solid squares) and SBUV observations (open triangles) is shown in the upper plot, while the percent difference (SBUV-Umkehr)/Umkehr*100 is shown in the lower plot. Data for only one layer - Umkehr layer 8 (approximately 38 to 43 km) - are shown here. This station was chosen to illustrate several common problems. First, the Umkehr data record is usually not homogeneous, with few observations before about 1985. As another example, there were no data in the WOUDC data archive for Lauder, New Zealand until 1987. Second, the data records at some stations appear to have shifts. In 1979-1982 period the average Boulder difference from SBUV in Umkehr layer 8 averaged near zero, while for the record in the post-El Chichon period (1984-1991) the difference averaged almost 10%, producing an apparent relative trend at this altitude of +6.6% per decade. If only data after 1984 are analysed, the trend would be near zero, but with a large uncertainty because of the shortness of the record. If such a shift relative to SBUV were seen at every station, this would be clear evidence that the calibration shift is in the SBUV instrument. Since the shifts occur at different times for different stations, they likely reflect changes in the ground-based instruments.

Figure 2-48 A sample comparison of one station - Boulder - for one layer in the atmosphere (Umkehr layer 8 covers approximately 38 km to 43 km). The ozone time series for Umkehr and SBUV are shown in the upper plot, while the percent difference (SBUV-Umkehr) is shown in the lower plot.
The regression analysis used here is quite simple - a linear fit is made to the time series of the SBUV-Umkehr difference. A difference plot removes most of the seasonal, QBO, and solar cycle variation, so a simple linear fit should be adequate. Based on previous experience [Hollandsworth et al., 1995] a more sophisticated multiple regression fit does a better job of determining the uncertainties of the trend, but the trend itself can be obtained accurately from such a fit. The results of this analysis for each station and for each layer are given in Table 2-12. The percent bias for each layer is given in the upper half of the table, while the relative trend is given in the lower half.
|
|
|||||||||||||
| Umkehr Layer |
|
|
|
|
|
|
|
||||||
| 10 New Delhi |
|
|
|
|
|
|
|
||||||
| 14 Tateno |
|
|
|
|
|
|
|
||||||
| 40 Haute Provence |
|
|
|
|
|
|
|
||||||
| 67 Boulder |
|
|
|
|
|
|
|
||||||
| 68 Belsk |
|
|
|
|
|
|
|
||||||
| 152 Cairo |
|
|
|
|
|
|
|
||||||
| 159 Perth |
|
|
|
|
|
|
|
||||||
| 256 Lauder |
|
|
|
|
|
|
|
||||||
| all stations |
|
|
|
|
|
|
|
||||||
|
|
||||||||||||
| 10 New Delhi |
|
|
|
|
|
|
|
|||||
| 14 Tateno |
|
|
|
|
|
|
|
|||||
| 40 Haute Provence |
|
|
|
|
|
|
|
|||||
| 67 Boulder |
|
|
|
|
|
|
|
|||||
| 68 Belsk |
|
|
|
|
|
|
|
|||||
| 152 Cairo |
|
|
|
|
|
|
|
|||||
| 159 Perth |
|
|
|
|
|
|
|
|||||
| 256 Lauder |
|
|
|
|
|
|
|
|||||
| all stations |
|
|
|
|
|
|
|
|||||
Table 2-12: Average bias and trend of SBUV relative to Umkehr
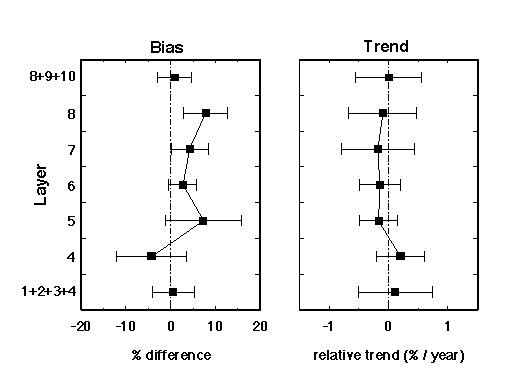
The left half of Figure 2-49 is a plot of the average of the station bias between SBUV and Umkehr for the 8 stations, for layers 4 through 8, and for combined layers 1-4 and 8-10. There is a tendency for SBUV to be higher than Umkehr by 5-7% in layers 5 through 8, lower by 5% in layer 4, and near agreement in the low combined layers 1-2-3-4, and in the high combined layers 8-9-10. The total column comparison shows SBUV about 3% higher than Umkehr.
The bias between SBUV and Umkehr is less interesting than the relative drift between the two measurement systems. One would like to see agreement between the systems since this would give confidence to the long term trends derived from each system. Unfortunately, there are significant differences. As shown in the right half of Figure 2-49, SBUV and Umkehr on average agree well, within 0.3% per year, in all layers, but with a fairly large variance among the stations. The Lauder time series is really too short to be compared independently and contributes much of the variance in the lower levels.

Figure 2-49 The altitude dependent bias (left plot) and trend (right plot) of SBUV relative to Umkehr. Note that combined layers are shown for Umkehr layers 1-4 and for layers 8-10.
While the SBUV/Umkehr comparisons show fairly good agreement, there are some problems with the comparison that should be kept in mind. First, it is important to screen the Umkehr stations to those that have stable instruments. Of the original 13 stations discussed in section 2.4.3, 5 stations had to be rejected because of obvious problems in the data record. There is also the problem that there was little Umkehr data in the early 1980's. One can argue that if station errors are random and enough stations are averaged, the result can be fairly stable. An optimistic conclusion would be that SBUV and Umkehr agree very well - to within 0.3%year-1, but the station-to-station variance is 0.3-0.7% per year. Umkehr should be much more usable for trend evaluation in the period after 1985 when the number of observations is much greater and the instrument calibrations are presumably better as a result of the program to inter-compare Dobson and Brewer instruments.
![]()