 |
Stratospheric Processes And their Role in Climate
|
||||||||
| Home | Initiatives | Organisation | Publications | Meetings | Acronyms and Abbreviations | Useful Links |
![]()
|
Stratospheric Processes And their Role in Climate
|
||||||||
| Home | Initiatives | Organisation | Publications | Meetings | Acronyms and Abbreviations | Useful Links |
![]()
An initial report and review of the SAGE measurement technique and instrument was presented in the Report of the International Ozone Trends Panel 1988 (WMO, 1988). The bulk of that material remains accurate and only a few changes or pertinent facts and overview material will be presented here.
The SAGE measurements of ozone are made through the solar occultation technique. Twice during a typical orbit, the SAGE instrument enters or exits the Earth's shadow. During these transitions the instrument views the sun through the atmosphere and scans across the solar disk in a plane parallel to the local vertical. For measurements high above the Earth's atmosphere, the sun is unattenuated by the atmosphere and these data can be used to calibrate the instrument responsivity. The high altitude, I0, scans are ratioed to the other scans to produce atmospheric transmission profiles. The fundamental measurement made by SAGE is a spectral slant path atmospheric transmission profile as a function of altitude. These transmission profiles are then used to infer aerosol extinction and species density profiles of ozone, NO2, and H2O as a function of altitude.
The solar occultation technique allows for a very narrow field of view to be utilised. Projected on to the limb of the Earth, SAGE II has a vertical field of view that is less than 0.5 km. The sampling and scanning rates are such that adjacent data points overlap by 50% (spaced by ~250 m). Because of the rate at which the sun rises or sets due to the orbital motion of the spacecraft, between 4 and 10 individual scans across the sun may contain observations of a particular altitude. For a 1 km altitude bin there are no fewer than 12, and sometimes as many as 30 separate data samples or transmission measurements. The horizontal extent of the measurements is 200 km along the line of sight by 2.5 km for a 1 km retrieved layer.
SAGE II is a seven channel spectrometer with channels at the following wavelengths: 385, 448, 453, 525, 600, 940, and 1020 nm. With the exception of the 448 and 453 nm pair the spectral resolutions (FWHM) are between 10 and 20 nm. The 448 channel has a bandwidth of 3 nm and the 453 channel a bandwidth of 2 nm.
The location of the measurements is determined by the orbit and is not programmable in flight. SAGE I and II were placed in a mid-inclination, 57o, orbits to provide nearly global coverage (complete seasonal sampling from 55°S to 55°N). Two measurements are made during each orbit, in a pattern similar to that of HALOE (Figure 1.5).
There are three primary instrumental sources of error with SAGE II. The first source of errors is due to the scan mirror reflectivity. The scanning of the field of view is accomplished by moving a scan mirror slightly less than 2.5o. The relative spectral reflectivity of the mirror must be known so that the I0 scans at one angular extreme can be transferred to the low altitude observations made at the other extreme. The mirror properties are monitored over a range of angles where the sun is between 100 and 250 km tangent height and found to vary by about 0.1% over the complete range of angular motion. The error in scan mirror reflectivity versus angle is of the order of 5%. The mirror reflectivity vs. angle is assumed to be linear for this small angular range. Early in the mission, the ERB satellite upon which SAGE II orbits was flipped upside down so that the unattenuated sun could be viewed over the full range of mirror motion to confirm the linear model. For the first four years of operation, the mirror properties remained stable. Since 1989 the mirror properties have been changing slowly with time, probably due to the oxidation or removal of the optical coating by atomic oxygen. In the current manner of processing the SAGE II data, mirror calibration data are processed in one year segments and applied retroactively. Data for the current year is processed with last year's (December 31st) value until the end of the current year when the calibration data are processed and the measurements reprocessed.
The second source of instrumental error is the assumption of radiometric stability during an occultation event (<4 minutes). The I0 scans can only be ratioed to other scans if the instrument sensitivity does not change during the event. In general this is true for SAGE II except for the 448 and 453 channels. It has been found that these channels exhibit a change in responsivity with a decay time of approximately 20 seconds. This does not represent a problem for sunset events because the I0 scan data can be taken after the initial transient. For sunrise, however, this transient occurs in the atmosphere. Fortunately, the transient is only significant in the 448 and 453 nm channels where it is a 0.25% effect. It is less than 0.05% in the other channels. While the cause is not known, the effect has been named the "thermal shock". The magnitude of the effect as a function of wavelength appears to be related to the amplifier gain (narrowness of the channel spectral bandwidth) and thus leads one to conclude that the cause is probably electronic in nature rather than thermal. Nevertheless, this error source affects the NO2 retrievals primarily. While there is the potential for errors in the NO2 retrieval to affect the retrieved ozone indirectly by way of an error in the short wavelength aerosol extinction, there are no observable effects on the ozone profiles. A method for correcting the effect was developed for Version 5.94 of the SAGE II algorithm and is presented in Section 1.2.6.
The last source of instrumental uncertainty relates to the long-term stability of the location and bandwidths of the channels. There is no way of determining the spectral location and bandwidths of the seven SAGE II channels in orbit. Channel locations and bandwidths are set by one of two methods. The SAGE II spectrometer disperses the spectrum and a series of slits and lenses determines the spectral characteristics of most of the broadband channels. The 448 nm channel is too narrow for this method and so the bandwidth is set by an interference filter. Similarly, the 453 and 940 channels employ interference filters since they are in the zero order beam of the grating. It has been determined that the 448 nm channel has been drifting in wavelength and increasing its bandwidth continuously and immediately after launch. To the best of our knowledge, this channel has moved on the order of 1 nm to longer wavelengths in the last 13 years and the bandwidth has increased by 30%. Again, this affects the NO2 measurements primarily and there is no observable effect on the ozone measurements at the 1% level. A first order correction for this drift in instrumental throughput is included in Version 5.96 of the SAGE II processing algorithm and is discussed later. There is no evidence to suggest that any of the other channels have moved or changed in any way. The changes in the 448 nm channel are thought to be due to the gradual movement, tilting, of the filter in its mount due the relaxation of residual stresses.
From previous ozone trend evaluation reports, it has been generally accepted that SAGE I's 385 nm filter was actually centred at 382 nm and that this caused an error of approximately 300 m in the reported SAGE I altitudes. The reason that the altitudes were affected by this wavelength error is that the SAGE I ephemerides were somewhat unreliable and the altitudes were therefore constrained by comparisons between the molecular scattering signature in the 385 nm channel and the densities estimated from the United States National Weather Service (NWS) temperature measurements.
More recently Wang et al. (1996) have shown evidence that the SAGE I height adjustment should vary with latitude probably because of small uncertainties in the geopotential heights in the upper stratosphere in the NWS measurements in 1979-1981. The first piece of evidence consisted of comparisons between proxies for the estimated heights of the ozone layer during the SAGE I and SAGE II observation periods (Figure 1.1a). An independent evaluation of the SAGE II height error was made by comparing the mean SAGE I and SAGE II (v 5.96) differences above the ozone peak using SBUV observations as a transfer standard (Figure 1.1a). Confidence in the results is provided by the fact that the error bars overlap for the two independent estimates at almost all latitudes.
Ideally, the SAGE I ozone profiles should have been retrieved again using the inferred altitude offsets. However for this report, an ad-hoc procedure has been used: the mean of the offsets shown in Figure 1.1a (see Figure 1.1b) was applied to move the previously retrieved ozone concentration profiles uniformly upward or downward. This procedure is believed to be quite accurate because the Rayleigh contribution to the 600 nm ozone retrieval is small at altitudes above 20 km (Chu et al., 1989). Below 20 km altitude however, a new retrieval of the SAGE I ozone profiles is necessary. The current SAGE I results below 20 km altitude are therefore considered to be unreliable. Above 20 km altitude, Figure 1.1b shows that there is an uncertainty of 100-150 m in the offset which should be considered in the evaluation of trends. This corresponds to an uncertainty in the SAGE I ozone values at 1 hPa of approximately 3%. Unfortunately some of the comparisons in Chapter 2 used a SAGE I offset which differed from those shown in Figure 1.1b but in almost all cases it was less than 100 m. This had no effect on the conclusions in that Chapter.
The version of the SAGE II algorithm used in the report is Version 5.96. What follows here is a brief description of the changes to the algorithm which was analysed and reviewed for the 1988 assessment. A lengthy and detailed discussion of the SAGE II algorithm can be found in the Report of the International Ozone Trends Panel 1988 (WMO report no. 18, 1988, pages 148-154) as well as Chu (1989). Since the WMO 1988 assessment, several changes and improvements have been made to the algorithm to account for known deficiencies. In general each distinct improvement is assigned a new version number.
Until the publication of this report Version 5.93 was the current public release of the SAGE II measurements and was basically the product described in the 1988 assessment. Version 5.94 includes a correction for the sunrise NO2 data. In addition to the changes in the sunrise NO2 profile there are indirect changes in the 385 nm aerosol extinction profile. The technique for isolating a responsivity change in the data is based on the temporal bias in the measured transmission at a particular altitude. Assuming that any measurement of the transmission at a particular altitude is as good as any other, the presence of a time correlated bias in transmission measured from successive scans is evaluated in the ratio of the 448 to 453 nm channels (this ratio is used to determine the NO2 slant column). This method produces a measure of the rate of change in responsivity and must be integrated in time to produce a correction. Only the 448/453 nm channel ratio is corrected and the effect of the correction is to change the sunrise NO2 profile with little if any effect on the retrieved ozone profile. Again, errors in NO2 may indirectly affect the ozone profile via errors in the short wavelength extinction. The changes in ozone are found to be less than 1%.
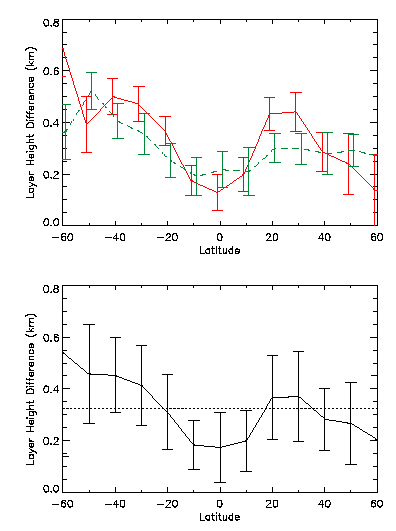
Figure 1.1. The estimated altitude error in the SAGE I observations (SAGE I profiles should be moved upwards by the amounts shown). The upper panel (a) shows the error estimated from comparisons of a proxy for the ozone layer height from SAGE I and SAGE II observations (full line, offset by 1° of latitude southward) and from mean differences between SAGE I and SBUV ozone observations in the upper stratosphere (dashed line, offset by 1° of latitude northward) (see Wang et al., 1996). The lower panel (b) shows the SAGE I height error estimate based on the mean of the two results in the upper panel (a); the standard deviation is based on the differences between the two results - this is particularly large at 60°S.
Version 5.95 contains an improved spectral aerosol extinction model which is designed to reduce the aerosol interference seen in the SAGE II ozone data. This version also includes a more realistic error estimate in the species retrievals attributed to uncertainties in estimating the aerosol extinction. This is discussed in Section 1.2.7. Version 5.96 accounts for a slow wavelength drift in one of the two differential NO2 channels, the 448 nm channel. The inclusion of this improves the long-term stability of the NO2 data set over the last 13 years. Like Version 5.94, this change has little if any impact on the retrieved ozone profile.
At this time, the SAGE II V5.96 ozone data can be used from 15 to 50 km for long-term trend studies and from 11 to 60 km for studies which do not strictly require long-term stability of the data set (e.g. spatial and seasonal investigations). The lower limits of 15 and 11 km must be above the tropopause. While there is a well known 10-15% difference between SAGE and ozonesonde profiles in the 15-20 km region, this difference is very stable with time and does not appear to affect the derived SAGE trends.
SAGE ozone retrievals require knowledge of the Rayleigh scattering contribution to the observed extinction at all wavelengths. Since SAGE I/II do not directly measure atmospheric density they rely on an external source (NCEP) for density information. At 55 km and again at 18 km the Rayleigh extinction is comparable to the ozone extinction. Any systematic or trend errors in density at these altitudes are represented one for one as errors in SAGE ozone.
There is an inconsistency in the use of an oblate Earth model in the SAGE algorithm. While the spacecraft ephemeris calculations use the oblate Earth model, the refraction calculation does not. This has the effect, especially for events taken at large b-angle where the events are 'smeared' over several degrees of latitude, of slightly stretching or compressing the altitude scale. Due to the peculiarities of the SAGE II orbit, the pattern of seasonal sampling, latitude and b-angle repeats from year to year so this bias in altitude is primarily a systematic error. The repetition from year to year is not exact however, and there may be a few isolated latitudes and seasons where the bias may appear as a trend over the SAGE II record.
A primary function of the SAGE II retrieval algorithm is the estimation of multi-wavelength aerosol line-of-sight optical depth simultaneously with the determination of line-of-sight ozone density using measurements at 385, 453, 525, 600, and 1020 nm. Since ozone significantly contributes to extinction at 453, 525, and 600 nm and aerosol contributes at all wavelengths, the solution is constrained by asserting that the aerosol contribution at 600 nm (where ozone absorption is the strongest) can be expressed as a linear combination of the aerosol contribution at the other 4 wavelengths. Ultimately, the ozone line-of-sight optical depth at 600 nm can be expressed as
![]()
where i is the measurement number (1 to 4), the vector a contains the coefficients inter-relating aerosol at 600 nm to that at the other channels, and cs contains the ozone cross sections at those four channels (relative to that at 600 nm). The values used for a can be derived in a number of ways but cannot unambiguously determine the 600 nm aerosol contribution.
Prior to Version 5.95, these coefficients were derived using a fairly tightly constrained linear inversion that performed well for moderate to low aerosol loading. However, in these earlier versions, a positive bias in the retrieval of ozone was observed during periods of elevated aerosol loading including following the eruption of Mt Pinatubo in 1991 and, more subtly, early in the SAGE II observational period (1984-1985). For Version 5.95, coefficients have been derived that perform better at high aerosol loading using a similar, though less tightly constrained, method. Figure 1.2 shows an example of the aerosol extinction estimated with the new coefficients during the post Pinatubo period. In the new approach, the coefficients are allowed to vary with altitude such that the previous "low-loading" coefficients are used at altitudes above 35 km. Unlike previous versions, a component reflecting the ability of this method to estimate aerosol at 600 nm has been included in the ozone error budget. Under most circumstances this does not significantly impact the estimated errors, however, following the eruption of Mt Pinatubo in 1991 errors are considerably larger where the aerosol is itself larger. It should be noted that this component of the error budget is not necessarily unbiased particularly immediately after the Mt Pinatubo eruption when aerosol size distributions (and extinction spectra) were more complex.
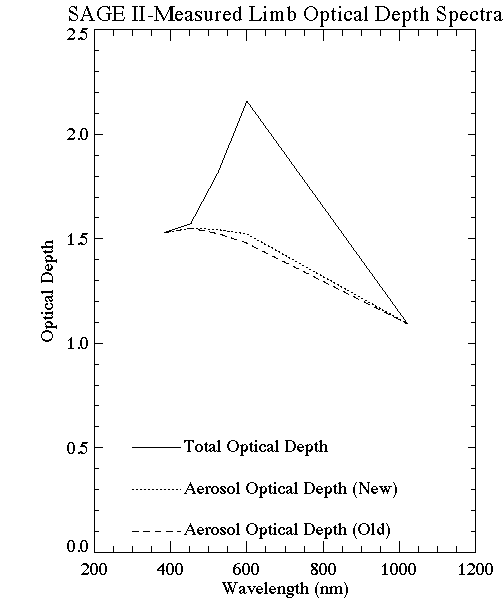
Figure 1.2. This figure shows an example of SAGE II-measured limb or line-of-sight optical depth for an event shortly after the eruption of Mt Pinatubo. The derived aerosol optical depth spectra for this event using the improved (5.96) and old versions (5.931) of the SAGE II processing algorithm are also shown. The new algorithm typically reduces ozone (relative to older versions) in this and other heavily volcanically perturbed periods due to the presence of large aerosol. (Northern mid-latitudes, March 1992, 20.5 km)
There is an apparent altitude bias in the SAGE II (and presumably SAGE I) data in the 15 to 20 km region. This bias, which can be 300 to 500 m, is likely due to a bias in the solar edge detection algorithm in the presence of a strong gradient (curvature actually) in the 1020 nm extinction profile. This bias is probably the cause of the long standing discrepancy between sondes and SAGE in this altitude region. The ozone gradient with height in this region is very steep, changing by 3% in 100 m. The stability of the ozone difference between SAGE and sondes indicates that any long-term trend in the potential altitude bias is less than 200 m over the SAGE II measurement period. The magnitude and temporal variation of this bias will be determined as part of the Version 6.00 development.
Version 5.96 still contains some known deficiencies which are under investigation. There remains a small unexpected and unexplained diurnal variation/bias in aerosol extinction and ozone density. The effect is small, a few percent and appears to be constant in time. This may or may not be related to the "January bias" reported by Wang et al. (1996). In addition there are at least two known improvements planned for the SAGE II algorithm.
Version 5.97 will merge the water vapour retrieval with that for the other species and include corrections for the mutual interference between H2O and O3 in the troposphere. It is anticipated that this will result in a significant improvement in the ability of SAGE II to measure tropospheric ozone.
Version 6.00 utilises an entirely new transmission algorithm to produce spectral transmission profiles with higher vertical resolution (approaching 0.5 km) and significant reductions in uncertainty (scatter or error bars). This new algorithm should remove an altitude bias in the 15 to 20 km region discussed previously.
|
|
|||
| Source |
|
(%) |
(%/year) |
| SAGE I ephemeris |
|
|
|
| SAGE I Rayleigh subtraction |
|
|
|
| Aerosol extinctiond |
|
|
|
| Edge time biasd |
|
|
|
| b-angle and oblateness |
|
|
|
| 448-nm channel filter |
|
|
|
| spectroscopy |
|
|
|
| Scan mirror calibration |
|
|
|
| Trends in density (Rayleigh) |
|
|
|
a Some uncertainty on how these errors may be partitioned
b For ozone with error estimates less than 12%
c for certain latitudes and seasons: high b-angle
d may be correlated
Table 1.1.
![]()