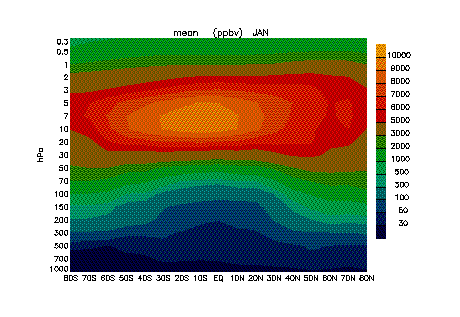
In the lower stratosphere below 70hPa the climatological ozone distribution is characterized by a poleward increase, which is most pronounced in the layer from 200-100hPa (see Fig.1).

Previous: Introduction Next: Ozone and Potential Vorticity Up: Ext. Abst.
Ozone and Origin of Air Masses
In the lower stratosphere below 70hPa the climatological ozone
distribution is characterized by a poleward increase, which is
most pronounced in the layer from 200-100hPa (see Fig.1).

Fig. 1: Mean ozone distribution for January, from Fortuin and Kelder,
1998, J. Geoph. Res., vol. 103, p. 31709-31734
It is this climatological relationship between ozone and latitude
that builds the basis for the present analysis. Trajectories on
lower stratospheric isentropes with a subtropical origin are typically
characterized by low ozone concentrations, whereas northern origins
correlate with positive ozone deviations in Switzerland, whereas
northern origins, i.e., large latitude values are correlated with
positive ozone deviations.
Because of the interannual variability the measurements are combined
to 4 seasons:
JFM (January, February, March),
AMJ (April, May, June),
JAS (July, August, September),
OND (October, November, December).
Maximum and minimum latitude values of every 10-day trajectory
are used to classify the profiles.
The trajectories are assigned to three different classes:
• S (Subtropic Origin) if minimum latitude is south of 32N,
• M (Midlatitude Origin) if minimum and maximum latitudes are between 32N and 70N,
• P (Polar Origin) if maximum latitude is north of 70N.
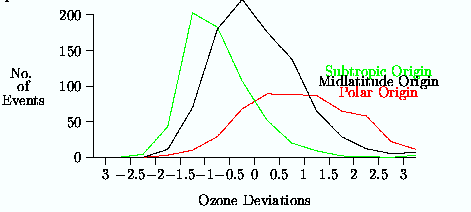
The following figure shows the numbers of events dependent on
ozone deviations divided up in these three classes.

Fig. 2: Number of events with a certain ozone deviation for the three
different origin classes
The dynamically most active seasons are winter and autumn, but
this classification also works for spring and summer.
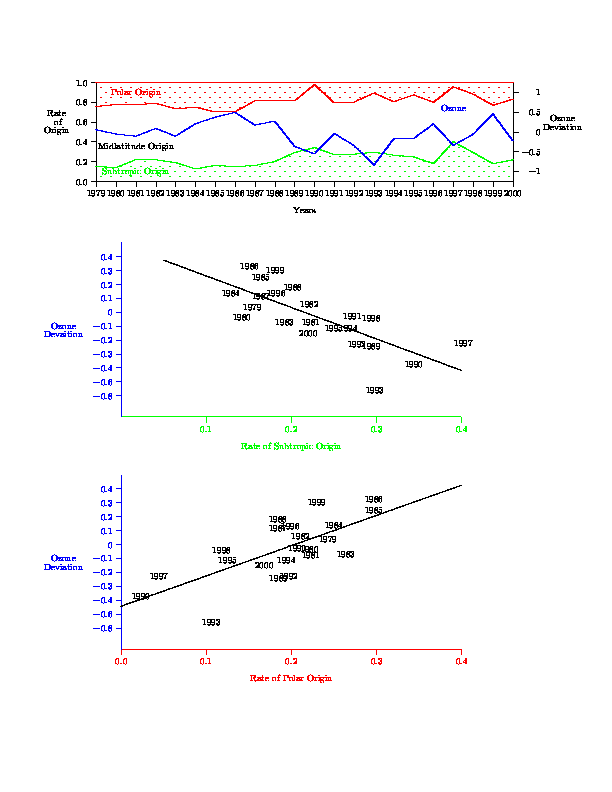
In the following we focus on the winter season (JFM) and potential temperature levels between 340K and 440K. The relative importance of the three classes changes much from year to year. The rate of trajectories with polar origin ranges between less than 5\% (in 1990) and nearly 30\% (in 1986), whereas the rate of subtropical origin varies between 15\% (in 1980) and 40\% (in 1997). Years with little polar trajectories, e.g.~1990 and 1997, show a high rate of subtropic origin and vice versa.
It can be seen in Fig. 3 that mean ozone deviations (in units
of standard deviation) also vary much from year to year and are
significantly correlated to both subtropic and polar origin frequencies.
There is a positive correlation of the ozone deviations with class
S and a negative correlation with class P.
The relatively low ozone values in the beginning and middle of
the 1990s can be well explained by the changes in the origins,
that is by atmospheric transport characteristics.

Fig. 3: Ozone Deviation and Origin of Air Masses for January - March
at 340K - 440 K
Although former studies, based on data up to 1997, found negative
trends in ozone on these altitudes (200hPa - 80hPa), there is
no trend in ozone on these levels if the last 22 years up to 2000
are considered and no discrepancy between observed ozone values
and those expected by the correlations with the air mass origin
classes.