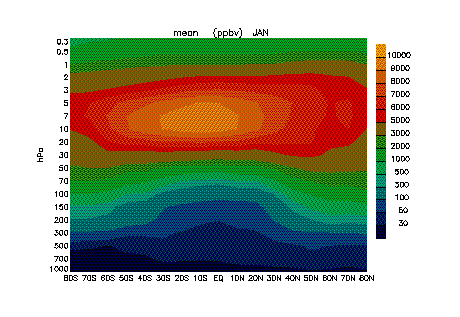
In the lower stratosphere below 70hPa the climatological ozone distribution is characterized by a poleward increase, which is most pronounced in the layer from 200-100hPa (see Fig.1).
Institute for Atmospheric Sciences, ETH Zuerich, Switzerland
gisela@atmos.umnw.ethz.ch
FIGURES
Abstract
Introduction
Vertical ozone profiles in northern mid-latitudes show large variability
and are strongly influenced by dynamical processes and the associated
atmospheric transport.
In this study we want to specify the dynamical contributions to
this variability and link ozone deviations with the origin of
air masses.
Ozone profiles have been measured 3 times a week by MeteoSwiss
at Payerne, Switzerland (46.80N, 6.95E, 490 a.s.l.) since autumn
1968.
The high resolution ozone profiles are sensored by a Brewer-Mast
sonde. A correction factor scales the soundings to match the total
ozone values measured at Arosa, Switzerland. Ozone deviations
are calculated with respect to the 30-year monthly means in units
of standard deviations in the lower and middle stratosphere. The
vertical range comprises the region of the climatological ozone
maximum.
10-day backward trajectory calculations were performed for each
of the ozone profiles between 1977 and 2000 with on 16 isentropic
surfaces between 340K and 700K which correspond to pressure levels
between about 300hPa and 20hPa. These calculations are based on
wind fields from the NCEP reanalysis data set.
Ozone and Origin of Air Masses
In the lower stratosphere below 70hPa the climatological ozone
distribution is characterized by a poleward increase, which is
most pronounced in the layer from 200-100hPa (see Fig.1).

Fig. 1: Mean ozone distribution for January, from Fortuin and Kelder,
1998, J. Geoph. Res., vol. 103, p. 31709-31734
It is this climatological relationship between ozone and latitude
that builds the basis for the present analysis. Trajectories on
lower stratospheric isentropes with a subtropical origin are typically
characterized by low ozone concentrations, whereas northern origins
correlate with positive ozone deviations in Switzerland, whereas
northern origins, i.e., large latitude values are correlated with
positive ozone deviations.
Because of the interannual variability the measurements are combined
to 4 seasons:
JFM (January, February, March),
AMJ (April, May, June),
JAS (July, August, September),
OND (October, November, December).
Maximum and minimum latitude values of every 10-day trajectory
are used to classify the profiles.
The trajectories are assigned to three different classes:
• S (Subtropic Origin) if minimum latitude is south of 32N,
• M (Midlatitude Origin) if minimum and maximum latitudes are between 32N and 70N,
• P (Polar Origin) if maximum latitude is north of 70N.
The following figure shows the numbers of events dependent on
ozone deviations divided up in these three classes.
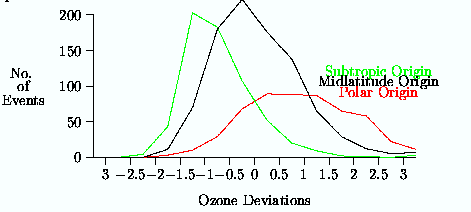
Fig. 2: Number of events with a certain ozone deviation for the three
different origin classes
The dynamically most active seasons are winter and autumn, but
this classification also works for spring and summer.
In the following we focus on the winter season (JFM) and potential temperature levels between 340K and 440K. The relative importance of the three classes changes much from year to year. The rate of trajectories with polar origin ranges between less than 5\% (in 1990) and nearly 30\% (in 1986), whereas the rate of subtropical origin varies between 15\% (in 1980) and 40\% (in 1997). Years with little polar trajectories, e.g.~1990 and 1997, show a high rate of subtropic origin and vice versa.
It can be seen in Fig. 3 that mean ozone deviations (in units
of standard deviation) also vary much from year to year and are
significantly correlated to both subtropic and polar origin frequencies.
There is a positive correlation of the ozone deviations with class
S and a negative correlation with class P.
The relatively low ozone values in the beginning and middle of
the 1990s can be well explained by the changes in the origins,
that is by atmospheric transport characteristics.
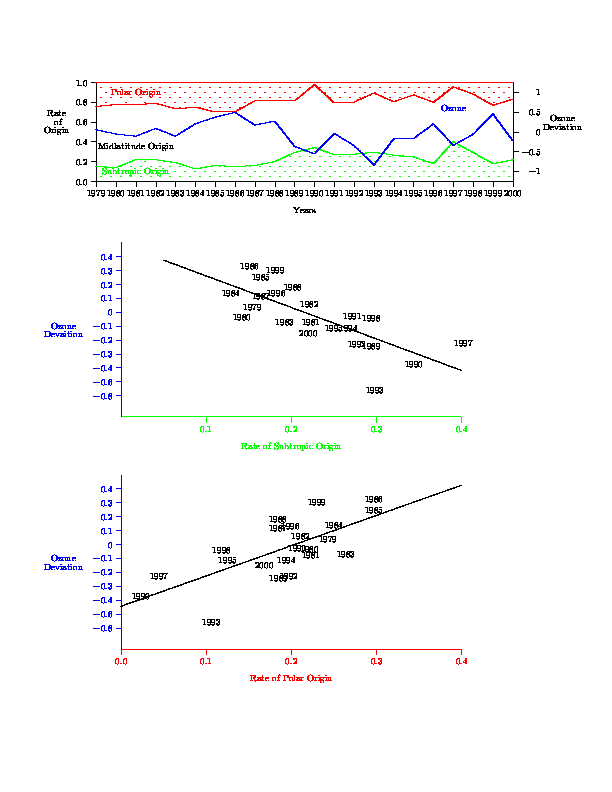
Fig. 3: Ozone Deviation and Origin of Air Masses for January - March
at 340K - 440 K
Although former studies, based on data up to 1997, found negative
trends in ozone on these altitudes (200hPa - 80hPa), there is
no trend in ozone on these levels if the last 22 years up to 2000
are considered and no discrepancy between observed ozone values
and those expected by the correlations with the air mass origin
classes.
Ozone and Potential Vorticity
As the mean PV distribution on isentropic surfaces shows high
PV values in the polar region and low values in the (sub)tropics,
PV also holds information about the origin of air masses arriving
at the measurement site in Payerne.
Inside the wintertime polar vortex PV values are particularly
high.Thus very high PV values along the trajectories indicate
transport of air masses from inside the vortex.
In the following PV deviations are calculated as the difference
between PV averaged along the 10-day trajectories and 22-year
PV averages in percent.
The time series in Fig.4 show the high year to year variability
of PV deviations between 340K and 440K, that correlate well with
the ozone deviations. This confirms the trajectory analysis shown
in Fig. 3.
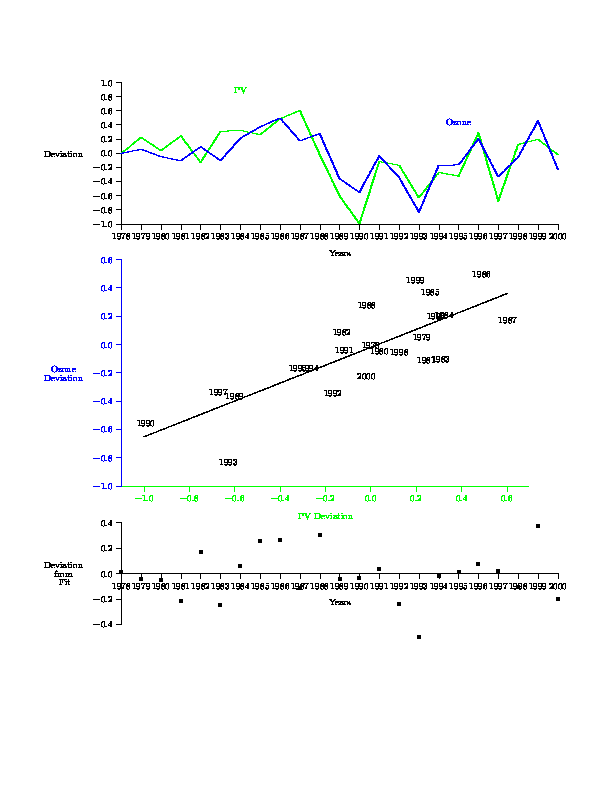
Fig. 4: Ozone and PV deviations for January - March at 340K - 440K
As already stated before, there is no trend in ozone and no trend
in the deviations from the fitted line on these levels.
In opposition to that a negative trend in the observed ozone values
can be seen at altitudes of 70hPa - 35hPa that correspond to potential
temperature levels between 460K and 560K. Ozone and PV deviations
are negatively correlated, but only in the 1980s (see fitted line
in Fig.5).
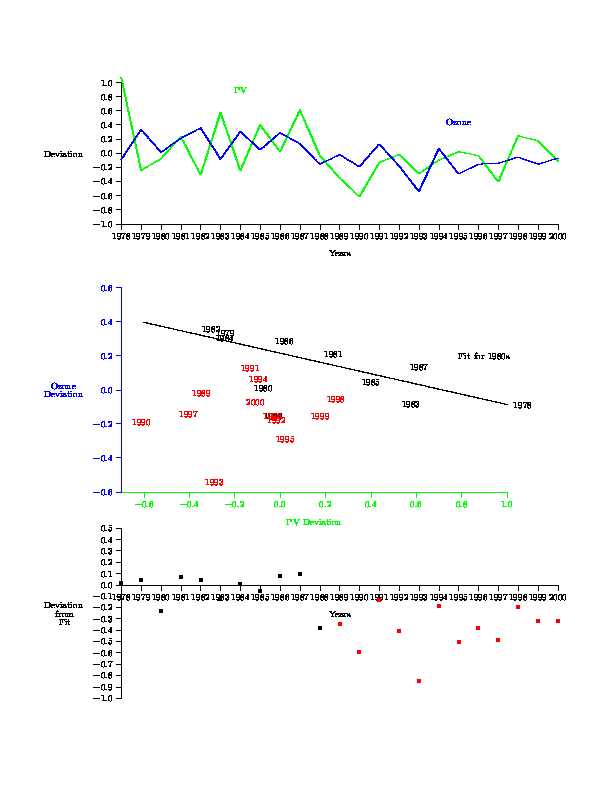
Fig. 5: Ozone Deviation and Origin of Air Masses for January - March
at 460K - 560K
A similar correlation can also be found in spring and summer.
However in the winters of the 1990s ozone values are systematically
lower than expected from this correlation. This is in contrast
to spring, summer and autumn where this correlation can be seen
until the year 2000. This can be viewed as evidence for chemical
ozone depletion during northern hemisphere winter.
Further studies will be performed to separate the influence of
ozone depletion in the polar vortex to mid-latitude ozone profiles
from in-situ processing of air at mid-latitudes.
Conclusions
• Between 460K and 560K: in the 1990s ozone values in winter are
smaller than expected by the fit to 1980s' values and can not
be explained dynamically in terms of varying origin.
• Between 340K and 440K: No trend in ozone at these altitudes. Variability can be dynamically explained by the changing frequencies of transport form polar vs. subtropical regions.
Back to
| Session 1 : Stratospheric Processes and their Role in Climate | Session 2 : Stratospheric Indicators of Climate Change |
| Session 3 : Modelling and Diagnosis of Stratospheric Effects on Climate | Session 4 : UV Observations and Modelling |
| AuthorData | |
| Home Page | |