Previous: Results Next: Concluding remarks Up: Ext. Abst.
Relationships to the Arctic Oscillation
In order to investigate stratosphere-troposphere coupled interannual
variation in the springtime seasonal march, a multiple empirical
orthogonal function (M-EOF) analysis for the zonal mean zonal
wind is conducted for each experiment. The EOF analysis is performed
by combining multiple periods of data in a vector xi as
xi = ( ui(n), ui(n+1), ui(n+2), ui(n+3)),
where ui(n) is the anomalous period-mean zonal mean zonal wind
at each height and latitude for the nth period of the ith year.
The EOFs are then defined as the eigenvectors of the correlation
matrix calculated from xi. The data in the north of 20o N and
from 850 hPa to 0.1 hPa are used here. The EOFs are calculated
for consecutive data of four period chosen as below; 1:APR 1-15,
2:APR 16-30, 3:MAY 1-15,4:MAY 16-30. It is noted that the calculation
is conducted over 40 years data for the ozone depletion experiment,
while done over 20 years data for the control experiment.
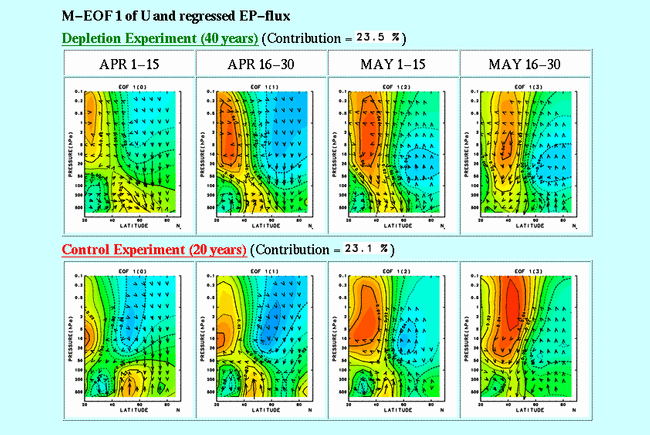
Figure 3 shows the first mode of the M-EOF (EOF1) obtained from
above analysis, which accounts for 23.5% of variance. From green
to blue colors show westerly anomalies, while yellow to red colors
show easterly anomalies. Arrows show E-P flux vectors regressed
with a time series of the EOF1, which are scaled for better visualization
(the scaling factor is differed across 120 hPa). In the ozone
depletion experiment (upper panels), a meridional dipole pattern
of the zonal wind, which corresponds to the structure consisting
of strong polar night jet in high latitudes and weak westerlies
in subtropics, becomes strong and moves poleward and downward
from the upper stratosphere to the troposphere with time, to form
a barotropic structure similar to the so-called Arctic Oscillation
[Thompson and Wallace, 1998]. On the other hand, in the troposphere,
a reversed meridional dipole pattern comparing to the stratospheric
one is found in the fist period; as the stratospheric dipole pattern
moves downward, the polarity of the dipole in the troposphere
is changed. In other words, a phase shift of the meridional structure
occurs in relation to the stratospheric final warming.
Concerning E-P flux vectors corresponding to this mode, we can
see that they direct toward two centers of easterly wind anomalies
in the stratosphere and troposphere. In high latitudes, E-P flux
vectors direct downward in April, while they reverse to the upward
direction in May. This implies that in years when the polar night
jet is kept strong until late spring, planetary wave activity
in April is weak throughout the troposphere and the stratosphere,
while in May it becomes strong. On the other hand, in the troposphere,
poleward and downward vectors of the E-P flux converge in high
latitudes to cause westerly acceleration in April, then meridional
divergence and convergence formed by the poleward directed E-P
flux moves easterly wind anomaly toward the subtropics until late
May. As a result, the strong polar night jet extends from the
lower stratosphere to the troposphere in late spring. Note that
the zonal wavenumber 1 component is dominant in the vertical component
of the E-P flux, whereas the zonal wavenumber 2 component is dominant
for the meridional component in the troposphere, throughout the
analysis period.

Figure 3. The M-EOF first mode for the zonal mean zonal wind, and regressed
E-P flux. E-P flux vectors are scaled for better visualization
by changing scaling factors across 120 hPa. Colors from green
to blue represent westerly anomalies, from yellow to red show
easterly anomalies. Horizontal axis shows latitude from 20o N
to the north pole (from left to right). Vertical axis shows pressure
from 850 hPa to 0.1 hPa.
On the other hand, EOF1 of the control experiment shows no systematic
coupling of the stratosphere and the troposphere (lower panels
in Fig.3). In this case the EOF1 accounts for 23.1% of variance.
Although meridional dipole anomaly of the zonal wind moves poleward
and downward in the stratosphere, it does not reach as deep as
troposphere and becomes weak in late May. In the troposphere,
meridional tripole pattern is seen throughout the period, and
corresponding E-P flux vectors dominated by the zonal wavenumber
3 component cannot bring about a wind anomaly reverse. Hence in
the ozone depletion experiment, the interannual variation of the
polar night jet, which is enlarged by the positive feedback mechanism
of the ozone depletion, extends to the troposphere to form the
stratosphere-troposphere coupling, i.e. the Arctic Oscillation.
At the end of this section, it is interesting to see the time
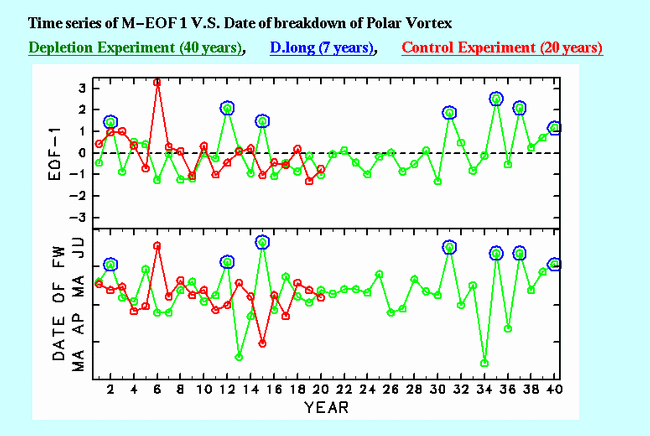
series of the EOF1 principal component. Figure 4 shows the time
series of EOF1 along with dates of the breakdown of the polar
vortex at 11 hPa, shown in Fig. 2. The time series of EOF1 is
well correlated with dates of final warmings. It is found that
extreme values which exceed a standard deviation of the principal
component hardly appear in successive years, except for the 8th
and 9th years in the ozone depletion experiment. In addition,
these time series seem to have neither apparent periodicity nor
trend, though no D.long years appeared for the 20-30th year period.
Similar periods are considered to happen irregularly, because
surface conditions of the GCM, such as SST, are fixed to climatology,
and therefore there is no external memory or decadal forcing.

Figure 4. Upper: Time series of the standardized principal component of
the EOF1. Green, blue and red circles denote those of the ozone
depletion experiment, the D.long years (see the text) and the
control experiment, respectively. Lower: Same as in Figure 2.
Previous: Results Next: Concluding remarks Up: Ext. Abst.

