Previous: Model and experiments Next: Relationships to the Arctic Oscillation Up: Ext. Abst.
Results
Seasonal marches and their interannual variations
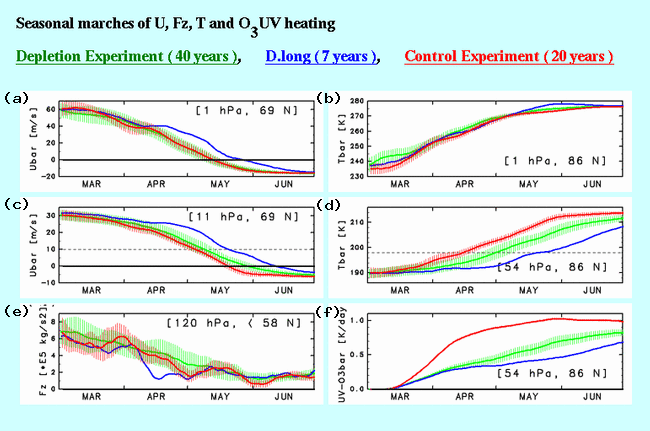
Figure 1 shows seasonal marches of zonal mean dynamical fields
and ozone UV heating at several high latitudes in the Northern
Hemisphere and levels. In each panel, green curve denotes the
average for the ozone depletion experiment, while red curve denotes
that for the control experiment. Vertical bars show standard deviations
for each calendars day. It is found that zonal mean zonal winds
and temperatures at 1 hPa for the both experiments show similar
seasonal marches, whereas in the lower stratosphere they are largely
different each other, especially for the temperature field. In
the ozone depletion experiment, the temperature at 86o N and 54
hPa are kept cold well below the threshold value of the ozone
loss term, 198 K, until the end of April, which is delayed by
about 2 weeks comparing to the control experiment. This is connected
with decreased ozone UV heating due to the Arctic ozone depletion.
For a period from the beginning of the sunlit period (mid-March
at 86o N) to the end of April, ozone UV heating in the ozone depletion
experiment is smaller than that in the control experiment by a
factor of 2. This is due mainly to the fact that the Arctic ozone
losses occur almost every spring in the ozone depletion experiment.

Figure 1. (a) Time series of the simulated zonal mean zonal wind at 69o
N and 1 hPa. Green, blue and red lines denote averages for "ozone
depletion experiment", "D.long years" (see the text) and "control
experiment", respectively. Vertical bars for the green and red
curves show standard deviations. (b) Same as (a) except for the
zonal mean temperature at 86o N and 11 hPa. (c) Same as (a) except
for the zonal mean zonal wind at 69o N and 11 hPa. Broken line
indicates 10 ms-1. (d) Same as (a) except for the zonal mean temperature
at 86o N and 54 hPa. Broken line indicates 198K. (e) Same as (a)
except for the vertical component of E-P flux averaged over north
of 58o N at 120 hPa. (f) Same as (a) except for the zonal mean
ozone UV heating at 86o N and 54 hPa.
It is also noted that the interannual variation, expressed by
the vertical bars, in the ozone depletion experiment is relatively
large throughout the period, which is closely connected with the
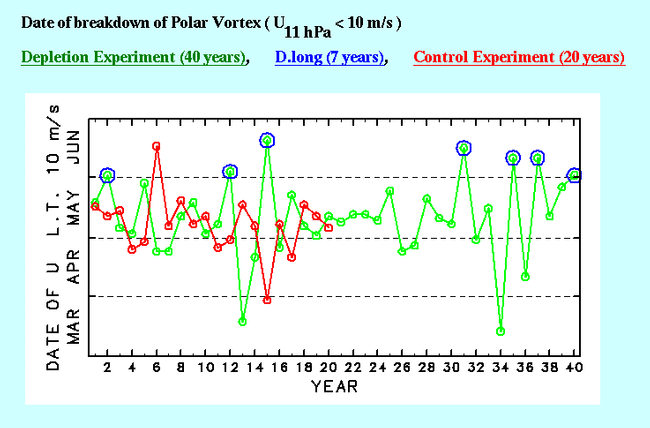
Arctic ozone depletion. Figure 2 shows the interannual variations
of the date of polar vortex breakdown at 11 hPa, which is defined
by the date when zonal mean zonal wind becomes smaller than 10
ms-1. Green circles show the breakdown date in the ozone depletion
experiment, and red ones show those in the control experiment.
The occurrence of final warmings in the ozone depletion experiment
widely distributes for the period from mid-March to late June.
As a result, in seven years denoted by blue circles, i.e. 2, 12,
15, 31, 35, 37, 40th years, the strong polar night jet and the
Arctic ozone depletion continue harmonically until June. We call
these seven years as 'D.long years' hereafter.

Figure 2. Interannual variation of date of breakdown of the polar vortex
at 11 hPa. Green, blue and red circles denote the ozone depletion
experiment, the D.long years (later than beginning of June) and
the control experiment, respectively.
The blue curve in Fig. 1 shows the average of each field in the
D.long years. Seasonal marches of the polar night jet, the polar
temperature and the ozone UV heating in the lower stratosphere
depart from each other from the latter half of April. In that
period, the vertical component of Eliassen-Palm (E-P) flux in
the lower stratosphere is smaller than other time series. Both
the easterly acceleration due to E-P flux divergence in the upper
stratosphere and the adiabatic heating related to descending motion
are small in high latitudes in the stratosphere (not shown). After
the period, final warmings occur in late May in the upper stratosphere,
but relatively strong westerlies, low temperature and small ozone
UV heating are maintained beyond the end of June in the lower
stratosphere. Moreover, the strong polar night jet and the low
temperature extend downward to the upper troposphere (not shown).
It is also found that decrease of UV heating due to the ozone
depletion in the polar lower stratosphere is a primary cause of
the thermal structure, which leads to keeping the polar night
jet strong until late spring. Similar to our former results [Hirooka
et al., 1999a, b], this causes strengthening and continuation
of the ozone depletion itself, through chemical destruction within
the polar vortex and interfering dynamical transport of ozone-rich
air from low latitudes. Hence, it is considered that the dynamically
calm period in late April is a precursor for these positive feedback
processes well shown in this experiment.
Previous: Model and experiments Next: Relationships to the Arctic Oscillation Up: Ext. Abst.

