South America ENSO teleconnection coherence patterns and their
impacts to tropospheric parameters over Buenos Aires
P. Ristori(1-2), J. Fochesatto(1-3), E. Quel(1), P. H. Flamant(3).
(1) UNSAM, Universidad de San MartĢn. Argentina.
(2) CEILAP (CITEFA-CONICET), 1603 Villa Martelli. Argentina.
(3) LMD, Laboratoire de MČtČorologie Dynamique, Ecole Polytechnique,
RD36, 91128 Palaiseau, France.
FIGURES
Ż
Abstract
Large Scale Meteorological Coupling is studied between the South
America Total Cloud Cover and ENSO (El NiŅo Southern Oscillation)
phenomena in its different phases (NiŅo, NiŅa and Normal) situation.
Based on a Singular Value Decomposition (SVD) technique we compute
the Heterogeneous Correlation Pattern for South America Region
from 1980 to 1999. Clustering the same nature events we identify
the teleconnection coherence zone and their influence regions
for each types of events. Finally, for the last NiŅo Event (1997/1998)
we compute the local incidence pattern in Buenos Aires where we
operate a Lidar Station and Radiometry (3436'S, 5826'W) as a
correlation between regional variables, affected by these Large
Scale Coupling, and the local variables measured in Buenos Aires,
Argentina.
1. Introduction
Large scale link between the interannual variations of ocean surface
temperatures in the equatorial central and eastern Pacific regions
to persistent regional and global atmospheric anomalies has been
demonstrated after many scientific works in the last decade.
A large scale abnormal warming in the equatorial Pacific known
as El NiŅo, refers to the large scale atmospheric effects related
to the surface ocean warming. During the El NiŅo episodes lower
than normal pressures are observed in the eastern tropical Pacific
and higher pressures are found over western Pacific as Indonesia
and northern Australia. These conditions characterize the warm
phase of the Southern Oscillation (SO), which is often referred
to as an El NiŅo Southern Oscillation (ENSO) episode.
During periods when ocean surface temperatures are colder (the
cold phase of the SO, know as La NiŅa), lower than normal pressures
are found over western Pacific region and higher pressures are
observed over the eastern tropical Pacific.
During a warm episode winter, mid-latitude low pressure systems
tend to be more strong than in normality in the the Gulf of Alaska
region. These systems pump abnormally warm air into western Canada,
Alaska and the extreme northern portion of the contiguous United
States. Storms also tend to be more vigorous in the Gulf of Mexico
and along the southeast coast of the United States resulting in
wetter conditions than normal in that region.
During cold episodes, colder ocean temperatures in the equatorial
central Pacific act to inhibit the formation of rain-producing
clouds over that region. Wetter conditions are also observed over
southeastern Africa and northern Brazil, during the northern winter
season. Drier conditions during cold episodes are observed along
the west coast of tropical South America, and at subtropical latitudes
of North America (Gulf Coast) and South America (southern Brazil
to central Argentina) during their respective winter seasons
During warm and cold episodes the normal pattern of tropical precipitation
becomes altered affecting the tropical atmospheric circulation
features. Also, during warm and cold episodes extratropical storms
and frontal systems follow paths that are significantly different
from normal, resulting in persistent temperature and precipitation
anomalies in many different regions
The relation of that warm and cold episodes in the central Pacific
with a highly precipitation anomalies persistence pattern in consistence
with different episodes from latitudes corresponding to North
America Wang H. et al. (1999), Barsugli et al. (1999), Bell et
al. (1999), up to South America and specially from southern Brazil
to the central Argentina Mechoso C. and Iribarren (1992), Lenters
and Cook (1995), Harzallah et al (1996),Grimm et al. (2000), Ropelewski
and Halpert (1987; 1989), Halpert and Ropelewski (1992).
Specifically a general description ENSO episode related with seasonal
mechanism was found in Aceituno, P (1988), Tziperman et al(1997)
and many others. Concerning to the upper-tropospheric circulation
features that accompany extreme phases of the Southern Oscillation
are discussed in the work of Arkin, 1982.
Evidence of ENSO teleconnection impacts over local parameters
such precipitation and TCC in South America are demonstrated by:
- Pinker and Laszlo (1992), studied the variability of solar irradiance
of Amazon basin.
- Piacentini R. (1998) quantifying the nebulosity fraction reduction
in the region of Rio de la Plate basin including Buenos Aires.
- P.Ristori et al, 2000 ILRC 2000 over Bs. As. (3436ķS 5826ķW)
region quantifying the temporal evolution of teleconnection coupling
evolution in time during the last ENSO episodes (1997//1998).
- Grimm et al (2000); was detected and calculated the coherence
rainfall response to the El NiŅo and La NiŅa events from 1957
to 1991.
- Mechoso et Iribarren (1992); was calculate the streamflow variability
in Uruguay country from 1901 to 1989 and detecting the ENSO phases.
In this work we present a geographical "coherence zone" identification
of the region having the major coupling variability driving by
ENSO events in their different phases: NiŅo (+1), La NiŅa (-1),
Normality (0) scrutiny from 1980 to 1999 period. Starting in section
2 with a description of data base used and the methodology utilized;
in the section 3 we present the principal results for this application.
Finally, with the objective to achieved the Air Quality implications
we compute the local influence over total incoming visible radiation
flux and their coupled variability over Mixed Layer Atmospheric
Boundary Layer Height, as a local parameter, for the last strong
ENSO event (1997//1998). Finally a summary and concluding remark
are presented in section 4.
2. Data and Methodology
The El NiŅo region SST and South America TCC data for the large
scale-to-regional study comes from the NCEP ń NCAR CDAS Reanalysis database. Visible integrated incoming radiation temporal series from 0800
ST to 1200 ST and the Atmospheric Boundary Layer (ABL) structural
parameter temporal series evolution used in the regional to local
scale analysis comes from the CEILAP (CITEFA-CONICET) center placed in Villa Martelli, Buenos Aires, Argentina.
The methodology involved in the large scale teleconnection process
between the El NiŅo 3 SST region and South America TCC is a Principal
Components (PC) based Canonical Correlation Analysis (CCA) as
presented in Bretheton et al., Barnet and Preisendorfer with further
analysis over SST studies in Wallace et al.
In this case only a small but representative number of PC modes
are retained to preserve the algorithm stability. CCA technique
uses an intrinsic normalization of the cross corvariance matrix
of the studied fields in the SVD analysis that translates the
othonormality from the spatial to temporal field. In few words
this means that the expansion coefficients (temporal series) of
each mode of each field has the following properties: If ak(t) is the expansion coefficient of the kth TCC pattern and bk(t) is the expansion coefficient of the kth pattern, then the CCA technique assures that:
< an(t),ak(t) > = nk, < bn(t),bk(t) > = nk, < an(t),bk(t) > = cn.nk (were cn is a nonnegative value)
This choice was taken to achieve the geophysical goal of isolating
the most significant Center Pacific SST natural oscillation from
the anomaly induced by the El NiŅo Process an then, via the Heterogeneous
correlation maps, detect coherent regions between this fields.
CCA expansion coefficients, patterns, weight vectors and correlation
maps were found for the 1960 - 2000 TCC and SST time series. Then
the most important SST CCA expansion coefficients were correlated
with the TCC to detect geographical coherence regions. This last
correlation was implemented both with the total time series and
for specific NiŅo, NiŅa and Normality periods. For this specific
periods it was employed a 2 years timeframe.
CCA expansion coefficients, patterns, weight vectors and correlation
maps were found for the 1960 - 2000 TCC and SST time series. Then
the most important SST CCA expansion coefficients were correlated
with the TCC to detect geographical coherence regions.
This last correlation was implemented both with the total time
series and for specific NiŅo, NiŅa and Normality periods.
After demonstrating the impact over the South America TCC, 1996-1998
visible incoming radiation and ABL height time series were used
to analyze the influence of this large scale variable over local
field variables during the last Normality and El NiŅo events.
In this case, correlation analysis was the selected tool to evidence
the coupling between this set of variables.
3. Results
In our first phenomenological approach to detect the influence
of the El NiŅo/La NiŅa events over the South America cloud cover
the whole 1960 - 1980 period is analyzed. The PC based CCA analysis
is implemented with the 5 more significative PC modes for each
field. Results of this study can be seen in Figure 1 for the first
tree modes. An important spatial correlation of the 80% was found
between the third CCA expansion coefficient of the 1960-2000 and
the El NiŅo 3 anomaly.
Previous studies (Ristori, Fochesatto et al., 2000) shows South
America coherence regions for the Normality 1995-1996 period and
for the last El NiŅo 1997-1998 period via SVD analysis. In this
case we can see a sort of similarity between the first two CCA
maps and the normality period maps and between the third CCA maps
and the anomaly period map.
In a second approach, a clustering technique based in the correlation
study for a given time frame identified by El NiŅo, Normality
or La NiŅa, compare the SST CCA expansion coefficients calculated
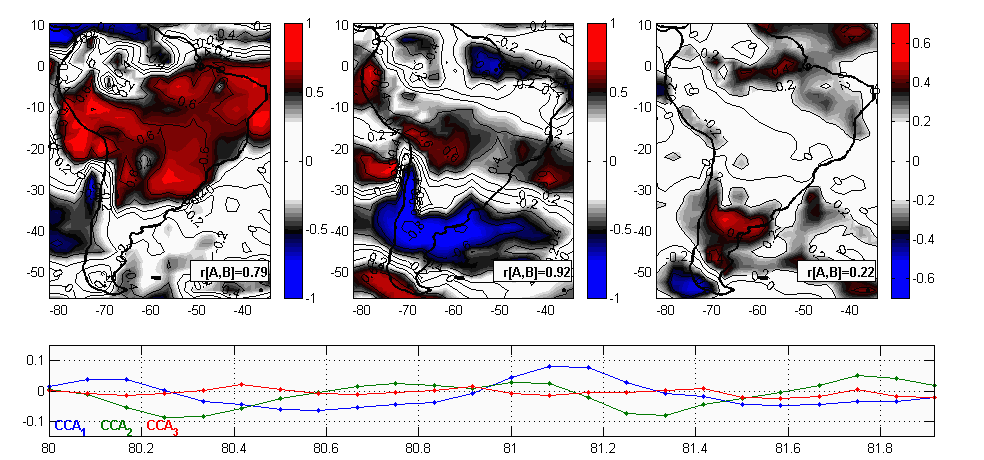
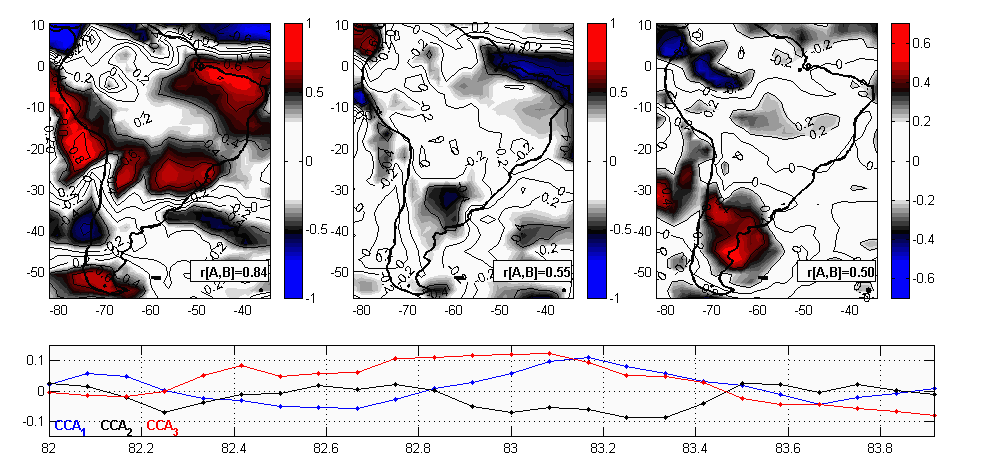
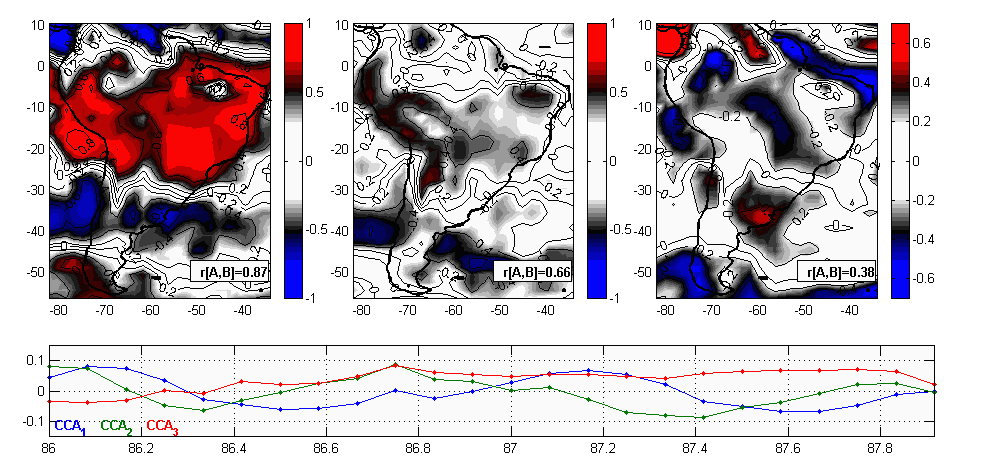
before and the South America TCC with results shown in Table 1.
CCA5,n means the 'n' canonical correlation of the 5 PC modes retained
in the CCA, r(ak,bk) in the temporal correlation between the most significative expansion
coefficients, SCF is the squared covariance fraction between the
true and the synthetic reconstructed covariance fraction for each
mode and the CSCF is the correspondant cumulative covariance fraction
taking into account the current as well as the previous calculated
modes. Finally, for this table, the correspondent heterogeneous
correlation maps are shown in figures 2 to 8.
After computing the large scale coupling, we proceed by a downscaling
process to quantify the regional to local impact process between
the most significant variables evolves in the air pollution process.
For the large to regional scale studies (only for the 1996-1998
period in which local measurements had been made), scatter plots
between the TCC and the Visible Radiation temporal series are
shown with -52% for normality and -78% for anomaly periods (Figure 9).
Figure 10 shows the linear correlation between Visible Radiation
an ABL height monthly mean with annual time lag.
In our first phenomenological approach to detect the influence
of the El NiŅo/La NiŅa events over the South America cloud cover
the whole 1960 - 1980 period was analyzed. Results of this study
can be seen in Figure 1. An important spatial correlation of the 80% was found between
the third CCA expansion coefficient of the 1960-2000 and the El
NiŅo 3 anomaly.
Previous studies (Ristori, Fochesatto et al, 2000) shows South
America coherence regions for the Normality 1995-1996 period and
for the last El NiŅo 1997-1998 period via SVD analysis. In this
case we can see a sort of similarity between the first two CCA
maps and the normality period maps and between the third CCA maps
and the anomaly period map.
In a second approach, a clustering technique based in the correlation
study for a given timeframe identified by El NiŅo, Normality or
La NiŅa, compare the SST CCA expansion coefficients calculated
before and the South America TCC with results shown in Table 1. The correspondent heterogeneous correlation maps are shown in
figures 2 to 8.
For the large to regional scale studies (only for the 1996-1998
period in which local measurements had been made), scatter plots
between the TCC and the Visible Radiation temporal series is shown
with -52% for normality and -78% for anomaly periods (Figure 9). Figure 10 shows the linear correlation between Visible Radiation an ABL
height monthly mean with annual time lag.
4. Discussion and Summary
Utilizing these clustering by episodes was possible to derive
geographic composite patterns from diferents TCC condition driving
by different SST phases behavior.
As primary conclusion we observe systematic pattern in the +1
and -1 conditions over South America centered in the Rio de la
Plata basin having a strong influence in the local parameters
such as the ventilation coefficients affecting the Air Quality
of Buenos Aires City.
The second one is a good agreement obtained with the rainfall
studies if it's considered the SST-TTC teleconnection as a precursor
mechanism of the rainfall impacts. In this case teleconnection
pattern (SST - TCC) was observed to have approximately the same
pattern to those obtained by Grim et al., 2000 in their rainfall
ENSO study. In particular for the "El NiŅo 1982, 1986, 1991" and
the "La NiŅa 1988" periods, we retrieve almost the same coherence
zone detected in their composite precipitation patterns studies
in the reference mentioned above. The coupling region cover the
central part of the Rio de la Plata Basin and in particular the
north-eastern of Uruguay and southern of Brazil as we see in our
teleconnection figures 3,4,5.
For the regional variables comparison we observe significant inter-annual
variation reflected over TCC, FV and ABL Height for the mean seasonal
values SON and DJF showed in Table 2.
Finally, evidence of ENSO coupling in time was observed in Table 3 where was calculated the inter-seasonal variations percents making
a direct comparison of the real to the expected (non-anomalies)
values each one. As an example, we shown for the transition periods
JJA to SON a ń33% extracted from lidar data, when the expected
seasonal variation was +37% corresponding to the moving values
towards spring season. The same situation was observed for the
SON to DJF with real -34% compared to the expected +20% corresponding
to the seasonal change from the spring to the summer in response
to the ENSO forcing.
5. References
Grimm et al, . 2000. Climate Variability in Southern South America
Associated with El NiŅo and La NiŅa Events', J. of Climate, 13,
35-58.
Mechoso C. and Perez Iribarren G. 1992. Streamflow in Southeastern
south America and the Southern Oscillation. J. of Climate,5. 1535-
1539.
Pinker R. and Laszlo I., 1992. Interannual Variability of Solar
Irradiance over the Amazon Basin Including the 1982-83 El NiŅo
Year. J. of Climate. 5. 1305-1314.
Wallace et al. 1992. Singular Value Decomposition of Wintertime
Sea Surface Temperature and 500-mb Height Anomalies. J of Climate,
5. 561-576.
Halpert M. and Ropelewski C. 1992. Surface Temperature Associated
with the Southern Oscillation. J. of Climate, 5. 577- 593.
Bretherton C. et al. 1992. An Intercomparison of Methods for Finding
Coupled Patterns in Climate Data. J. of Climate. 5. 541-560.
Barsugli J. et al. 1999. The Effect of the 1997/98 El NiŅo on
Individual Large-Scale Weather Events. Bull. Amer. Meteor. Soc.,
80, 1399- 1411.
H. von Storch and A. Navarra. Analysis of Climate Variability.
Springer Verlag. Berlin, 1995.
Tziperman et al. 1997. Mechanism of Seasonal ń ENSO Interaction.
J. Atmos. Sci., 54, 61-71.
Lenters J. and Cook K., 1995. J. of Climate, 8, 2988-3005.
Harzallah et al. 1996. Interannual Rainfall Variability in North-East
Brazil: Observation and Model Simulation. Int. J. of Climatol.,
16, 861-878.
Wang H et al. 1999. Prediction of Seasonal Mean United States
Precipitation Based on El NiŅo Sea Surface Temperatures. Geophys.
Res. Lett., 9, 1314-1344.
Bell G. et al. 1999. Climate Assessment for 1998. Bull. Amer.
Meteor. Soc., 80, 1999- .
Piacentini R. Influencias del Evento El NiŅo 1997-1998 sobre las
intensidades solares globales incidents sobre Rosario, Argentina.
ASADES, 2. N 2, 1998.
Ropelewski and Halpert 1987.Global and Regional Scale Precipitation
patterns associated with the El NiŅo/Southern Oscillation. Mon.
Whea. Rev. 115, 1606-1626.
Ropelewski and Halpert 1989.Precipitation patterns associated
with the high index phase of the Southern Oscillation. J. of Climate,
2, 268-284.
Aceituno P. 1988, On the functioning of the Southern Oscillation
in the South America Sector. Mon. Wea. Rev. 116, 505-525.
Arkin, 1982. The Relationship Between Interannual Variability
in the 200mb Tropical Wind Field and the Southern Oscillation.
Mon. Wea. Rev., 110, 1393-1404.
P. Ristori et al. 2000, Evidence of ENSO teleconnection with tropospheric
ABL Dynamic parameters. Proceedings of 19th ILRC, France.
P. Ristori et al. 2000, ClimatologĢa de la capa lĢmite atmosfČrica
en Buenos Aires: Impacto de ENSO. Accepted for publications for
Anales AFA 2000.
Fochesatto et al. 2000, A survey of ABL Dynamics in Buenos Aires:
A climatological study. Proceedings of 19th ILRC, France.
Ż
6. Figures and Tables
Table 1
|
Event
|
Mode
|
r(ak,bk)
|
TCC field
|
SST field
|
SCF
|
CSCF
|
| Period 1960 - 2000 |
C5,1
|
84.32
|
22.62
|
15.78
|
20.17
|
20.17
|
| Ż |
C5,.2
|
71.12
|
10.20
|
36.47
|
23.89
|
73.87
|
| Ż |
C5.,3
|
50.12
|
8.46
|
32.07
|
10.60
|
90.39
|
| Normality 80-81 |
C5,1
|
79.24
|
21.67
|
24.44
|
12.28
|
12.28
|
| Ż |
C5,2
|
91.81
|
13.77
|
51.50
|
37.63
|
54.13
|
| Ż |
C5,3
|
22.08
|
0.64
|
6.24
|
2.69
|
62.71
|
| NiŅo 82-83 |
C5,1
|
84.32
|
17.81
|
20.21
|
27.58
|
27.58
|
| Ż |
C5,2
|
54.91
|
8.38
|
42.79
|
5.27
|
30.69
|
| Ż |
C5,3
|
50.14
|
5.09
|
55.63
|
13.06
|
35.95
|
| NiŅo 86-87 |
C5,1
|
87.32
|
23.63
|
10.79
|
5.82
|
5.82
|
| Ż |
C5,2
|
66.11
|
9.66
|
38.00
|
12.57
|
42.79
|
| Ż |
C5,3
|
38.16
|
8.52
|
37.65
|
1.05
|
44.36
|
| NiŅa 88-89 |
C5,1
|
77.99
|
17.73
|
13.57
|
12.66
|
12.66
|
| Ż |
C5,2
|
71.55
|
12.67
|
27.37
|
6.05
|
27.46
|
| Ż |
C5,3
|
51.91
|
12.69
|
47.06
|
8.95
|
60.78
|
| Normality 90-91 |
C5,1
|
93.41
|
11.87
|
8.45
|
5.61
|
5.61
|
| Ż |
C5,2
|
80.19
|
14.09
|
32.38
|
32.54
|
45.69
|
| Ż |
C5,3
|
32.98
|
7.63
|
10.50
|
0.03
|
43.52
|
| Normality 95-96 |
C5,1
|
89.57
|
18.01
|
20.27
|
7.42
|
7.42
|
| Ż |
C5,2
|
87.30
|
13.70
|
38.00
|
29.76
|
58.28
|
| Ż |
C5,3
|
64.86
|
8.86
|
25.86
|
3.69
|
63.92
|
| NiŅo 97-98 |
C5,1
|
89.93
|
15.47
|
20.05
|
7.32
|
7.32
|
| Ż |
C5,2
|
51.78
|
6.80
|
40.74
|
2.73
|
11.63
|
| Ż |
C5,3
|
64.81
|
16.82
|
54.78
|
41.04
|
51.79
|
Ż
Figure 1 - CCA for the period 1960 - 2000
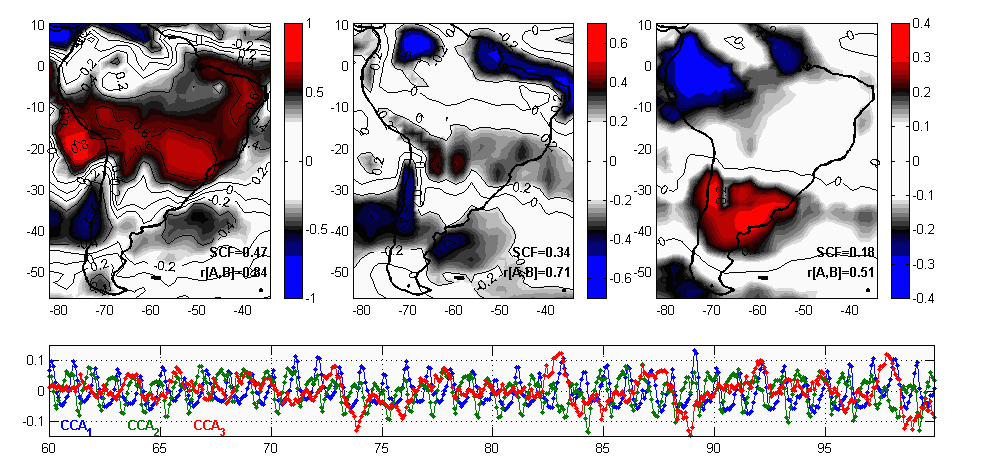
Figure 1: The tree first three heterogeneous correlation maps and their
respective expansion coefficients below. SCF is the Squared Covariance
Fraction while r[A,B] is the relation between expansion coefficients.
<Return to Table>
Figure 2 - Normality '80 - '81
<Return to Table>
Figure 3 - El NiŅo '82 - '83
<Return to Table>
Ż
Figure 4 - El NiŅo '86 - '87
<Return to Table>
Figure 5 - La NiŅa '88 - '89
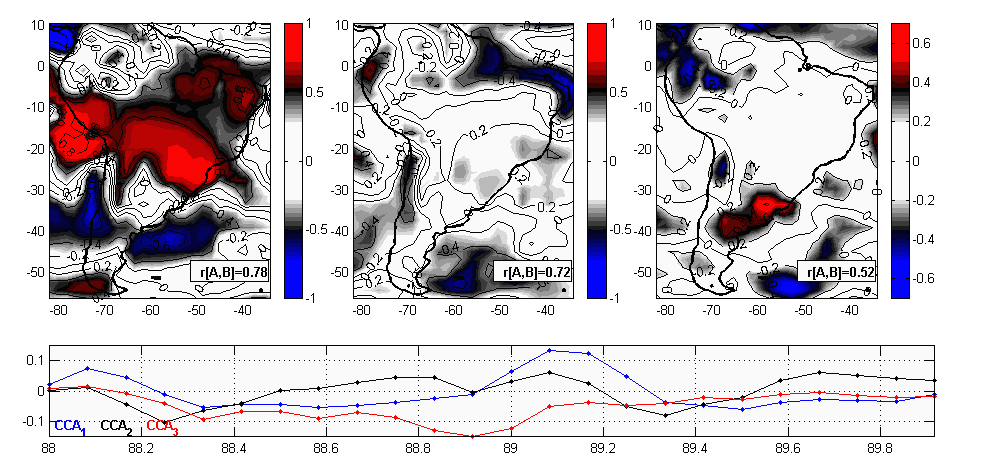
<Return to Table>
Ż
Figure 6 - Normality '90 - '91
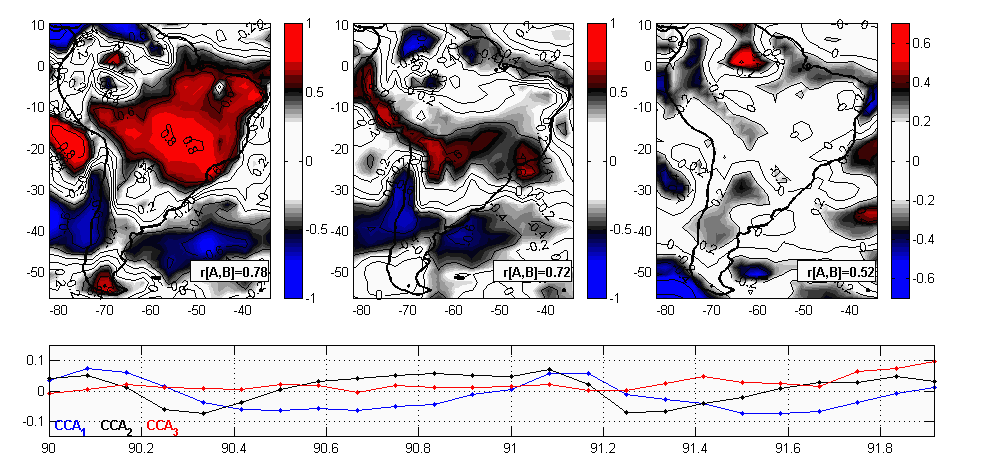
<Return to Table>
Ż
Figure 7 - Normality '95 - '96
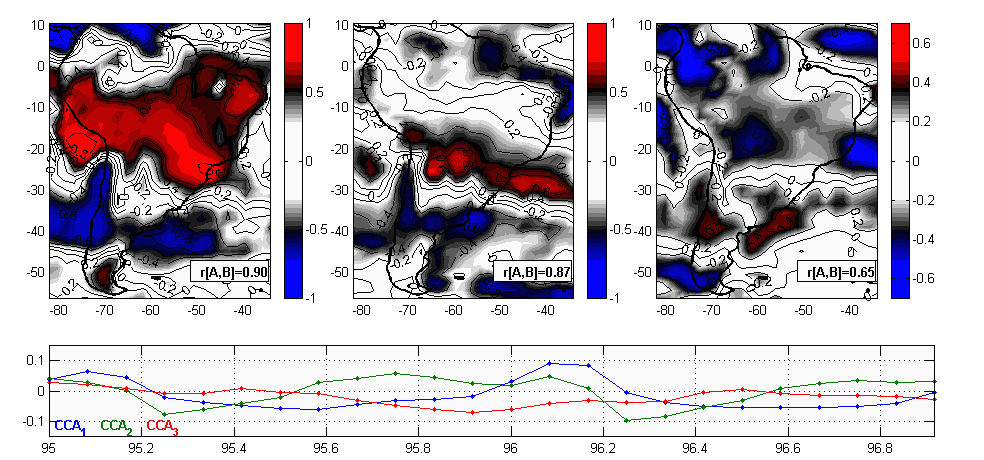
<Return to Table>
Ż
Figure 8 - El NiŅo '97 - '98
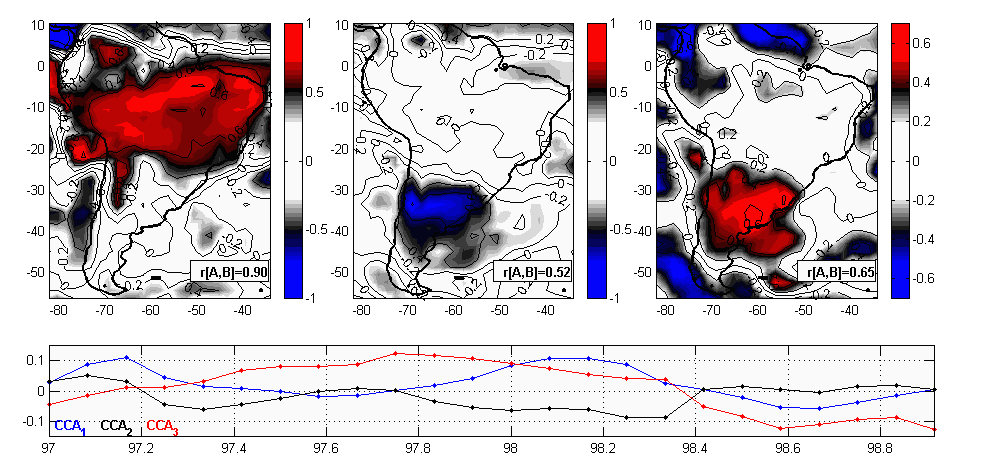
<Return to Table>
ŻŻ
Figure 9 - Comparison between TCC and Local VR radiation
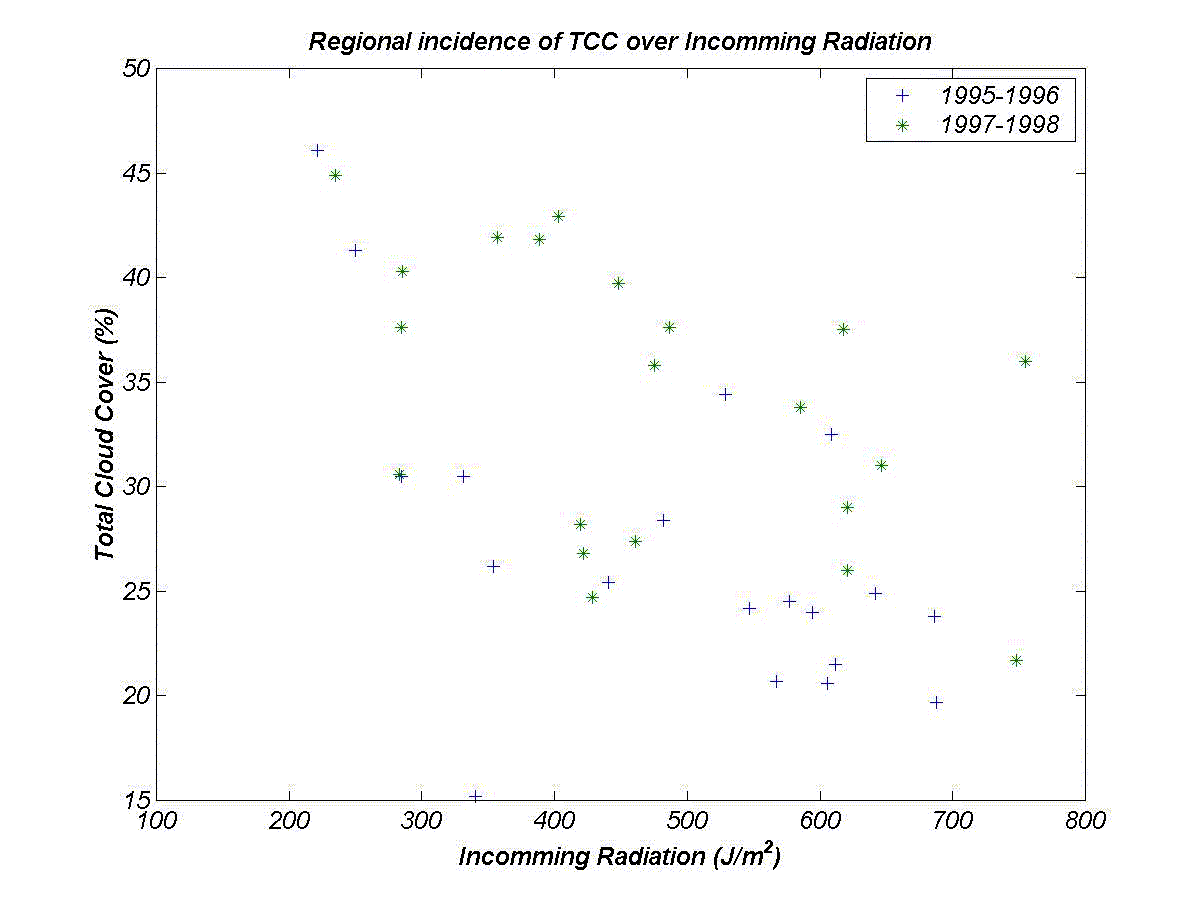
- Correlation for normality period: -52%
- Correlation for anomalies: -78% .
<Return to Text>
Ż
Figure 10 - Comparison between ABL Height and Local VR radiation data
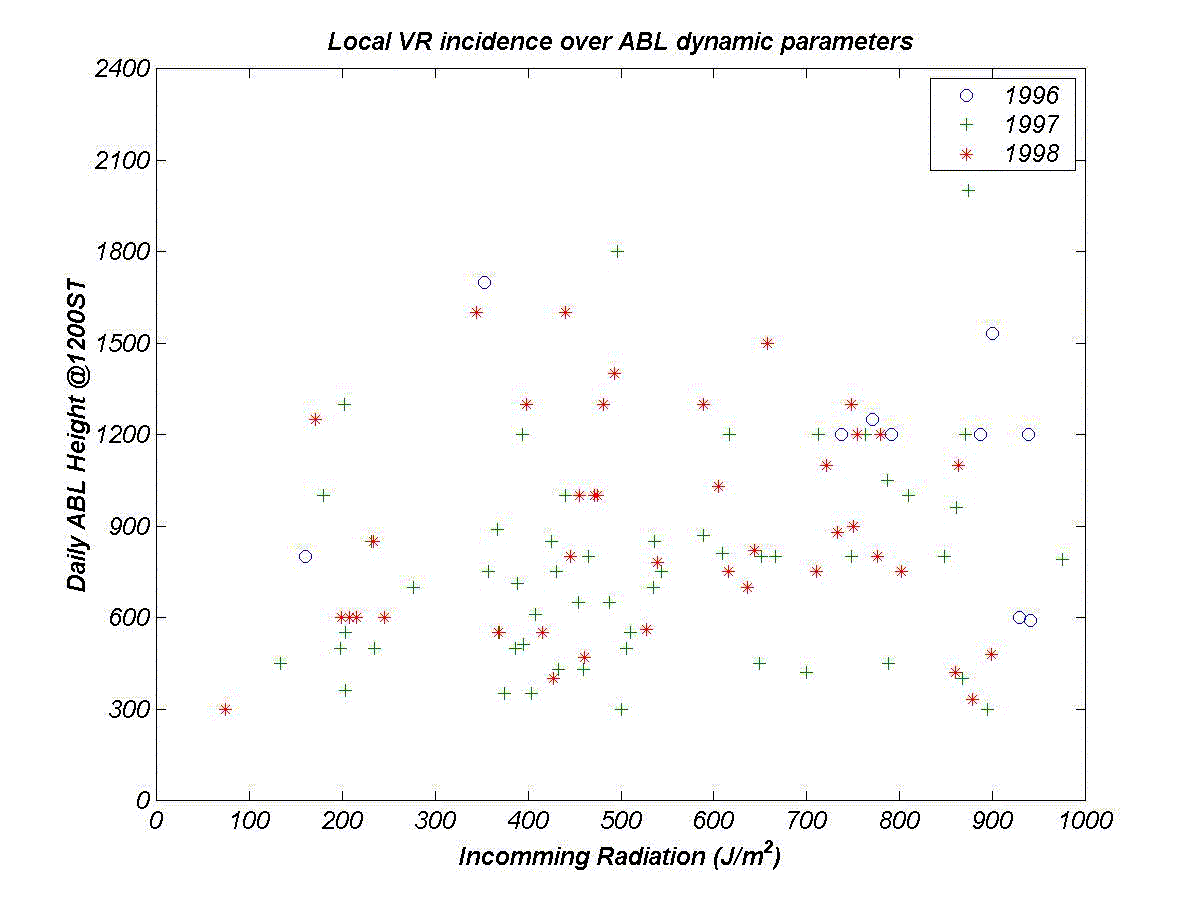
- Correlation for 1996: 18.0%
- Correlation for 1997: 34.5%
- Correlation for 1998: 17.2%
<Return to Text>
Ż
Table 2 - Inter-annual coefficients (1997 // 1998)
|
SON
|
DJF
|
|
TCC
|
+21.0%
|
+45.5%
|
|
FV
|
-42.0%
|
-43.5%
|
|
ABL - Heigth
|
-54.3%
|
-30.0%
|
Ż
To achieve the 1997/1998 ENSO impact from regional to local scale,
inter-annual and inter-seasonal projection coefficients are calculated
over the regional and local coupled geophysical variables. We
specialized the computation for the inter-annual coefficient variation
between 1997//1998 for the seasonal period SON (September-October-November)
and DJF (December-January- February).
<Return to Text>
Ż
Table 3 - Inter- seasonal coefficients (real // expected)
|
JJA (97) > SON(97)
|
SON (97) > DJF(98)
|
|
TCC
|
- 17 % // - 33 %
|
-1 % // -34 %
|
|
FV
|
+ 30 % // + 35 %
|
-18 % // +24 %
|
|
ABL
|
- 33% // + 37%
|
-34 % // +20 %
|
Ż
Inter-seasonal variations for transition JJA (June-July-August),
SON and DJF seasonal periods from the second half of 1997 to the
first season of 1998 was calculated to shown the inter-seasonal
coupled evolution over projected normality values as pre-filtering
the anomalies values.
Back to


