|
|
|
|
|
|
|
|
| Period 1960 - 2000 |
|
84.32
|
22.62
|
15.78
|
20.17
|
20.17
|
|
|
71.12
|
10.20
|
36.47
|
23.89
|
73.87
|
|
|
|
50.12
|
8.46
|
32.07
|
10.60
|
90.39
|
|
| Normality 80-81 |
|
79.24
|
21.67
|
24.44
|
12.28
|
12.28
|
|
|
91.81
|
13.77
|
51.50
|
37.63
|
54.13
|
|
|
|
22.08
|
0.64
|
6.24
|
2.69
|
62.71
|
|
| Niño 82-83 |
|
84.32
|
17.81
|
20.21
|
27.58
|
27.58
|
|
|
54.91
|
8.38
|
42.79
|
5.27
|
30.69
|
|
|
|
50.14
|
5.09
|
55.63
|
13.06
|
35.95
|
|
| Niño 86-87 |
|
87.32
|
23.63
|
10.79
|
5.82
|
5.82
|
|
|
66.11
|
9.66
|
38.00
|
12.57
|
42.79
|
|
|
|
38.16
|
8.52
|
37.65
|
1.05
|
44.36
|
|
| Niña 88-89 |
|
77.99
|
17.73
|
13.57
|
12.66
|
12.66
|
|
|
71.55
|
12.67
|
27.37
|
6.05
|
27.46
|
|
|
|
51.91
|
12.69
|
47.06
|
8.95
|
60.78
|
|
| Normality 90-91 |
|
93.41
|
11.87
|
8.45
|
5.61
|
5.61
|
|
|
80.19
|
14.09
|
32.38
|
32.54
|
45.69
|
|
|
|
32.98
|
7.63
|
10.50
|
0.03
|
43.52
|
|
| Normality 95-96 |
|
89.57
|
18.01
|
20.27
|
7.42
|
7.42
|
|
|
87.30
|
13.70
|
38.00
|
29.76
|
58.28
|
|
|
|
64.86
|
8.86
|
25.86
|
3.69
|
63.92
|
|
| Niño 97-98 |
|
89.93
|
15.47
|
20.05
|
7.32
|
7.32
|
|
|
51.78
|
6.80
|
40.74
|
2.73
|
11.63
|
|
|
|
64.81
|
16.82
|
54.78
|
41.04
|
51.79
|
Figure 1 - CCA for the period 1960 - 2000
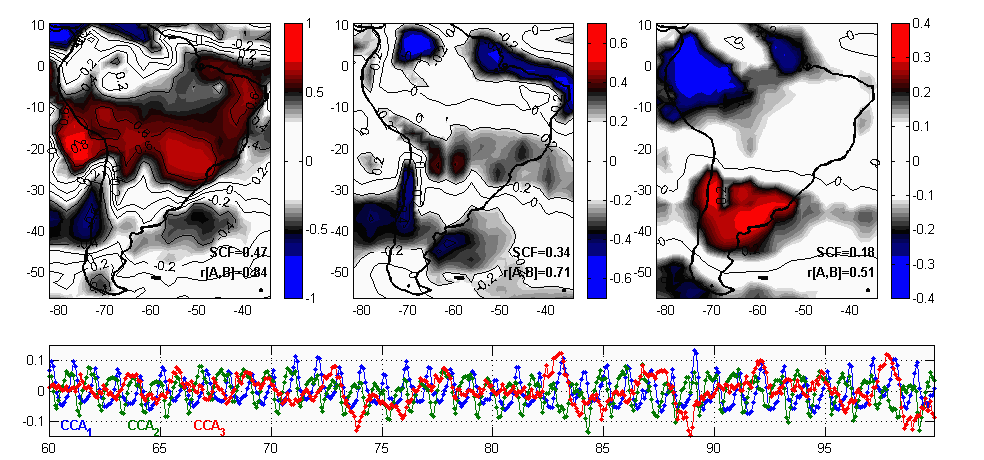
Figure 1: The tree first three heterogeneous correlation maps and their respective expansion coefficients below. SCF is the Squared Covariance Fraction while r[A,B] is the relation between expansion coefficients.
Figure 2 - Normality '80 - '81
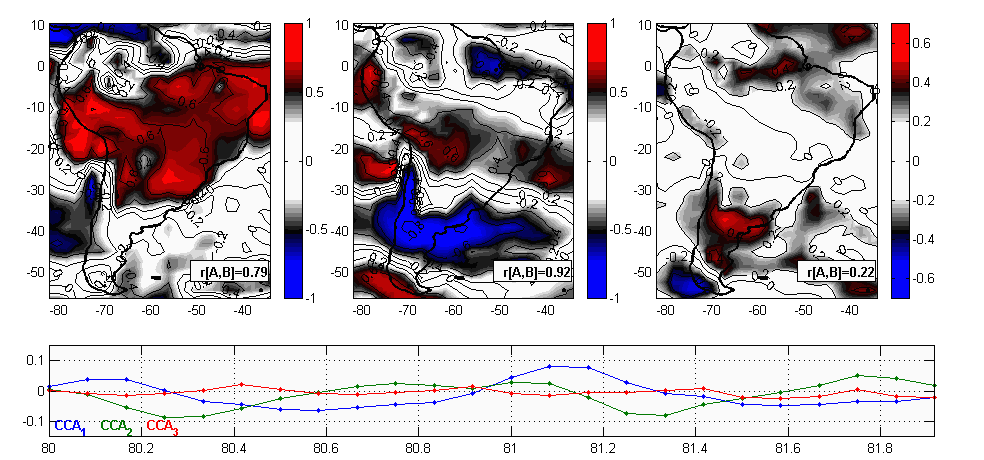
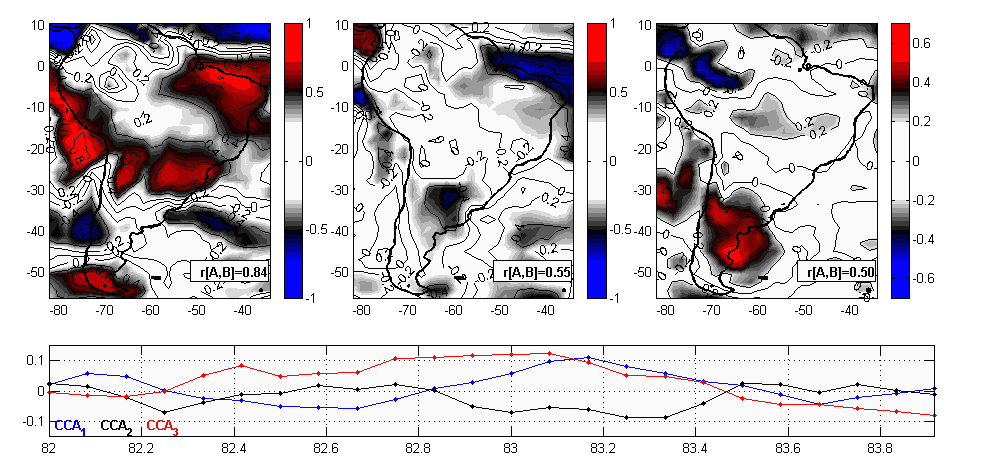
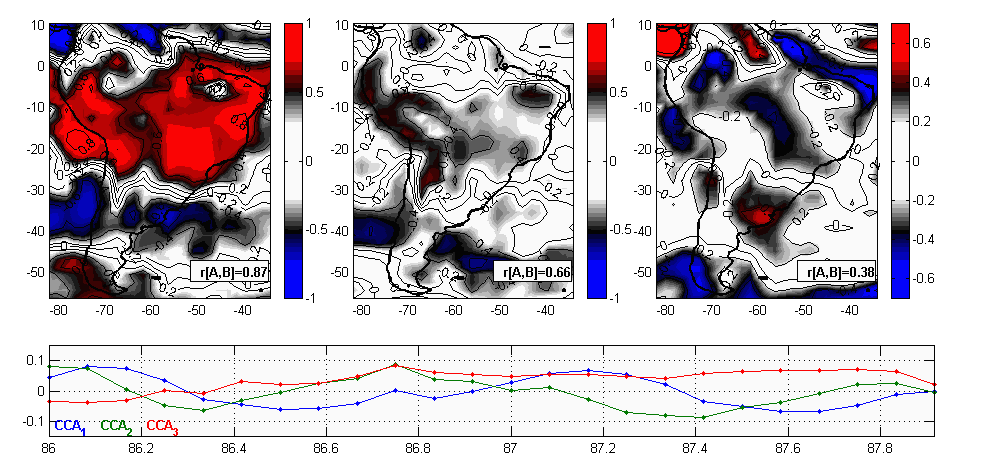
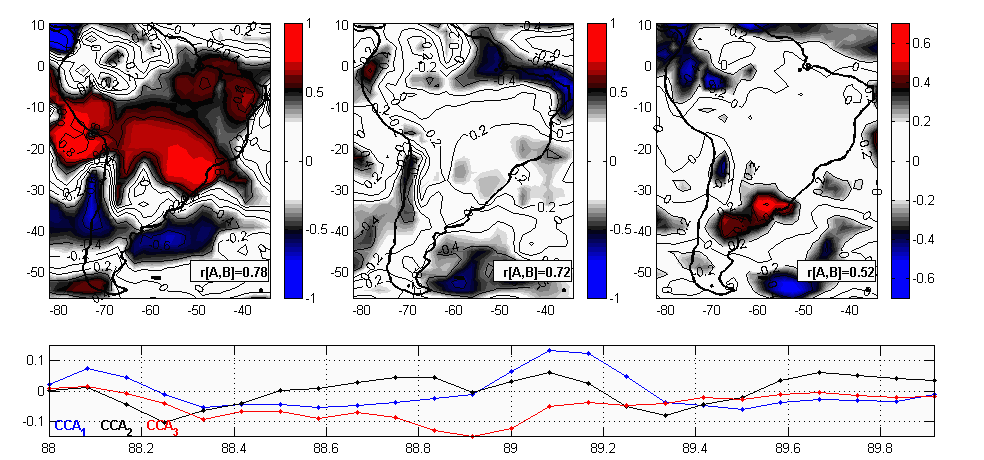
Figure 6 - Normality '90 - '91
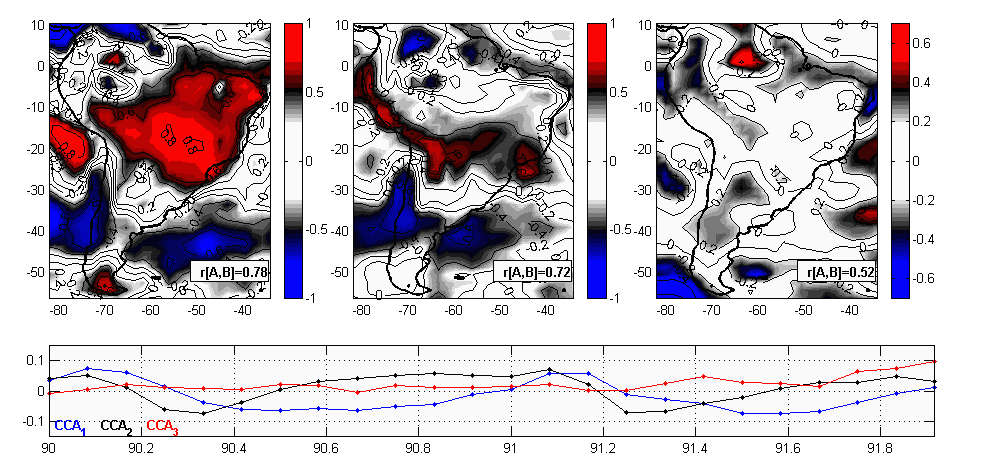
Figure 7 - Normality '95 - '96
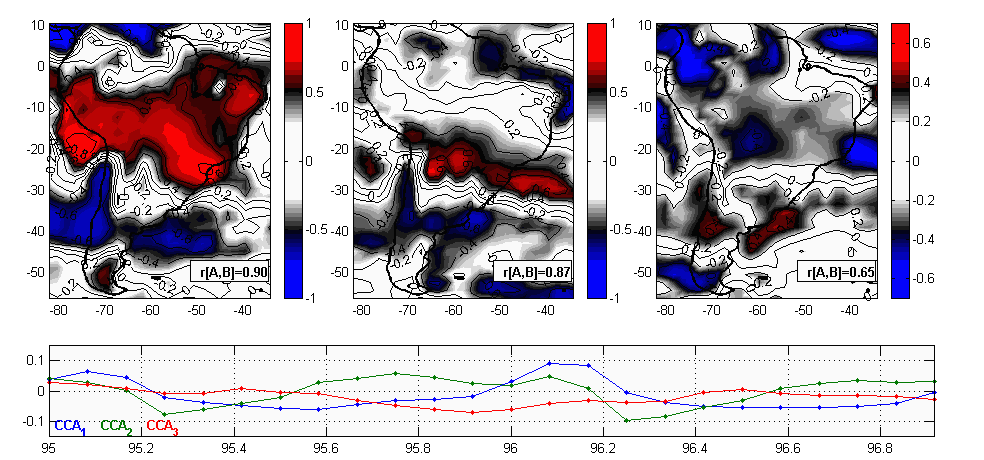
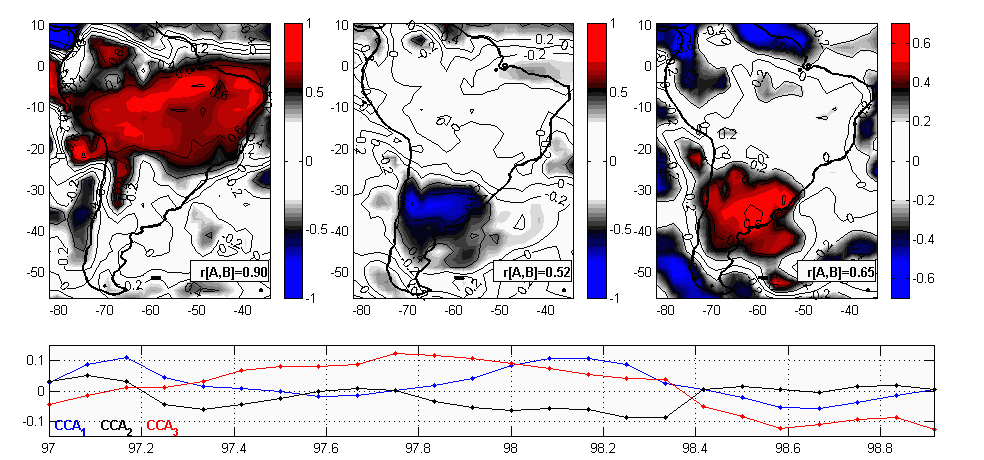
Figure 9 - Comparison between TCC and Local VR radiation
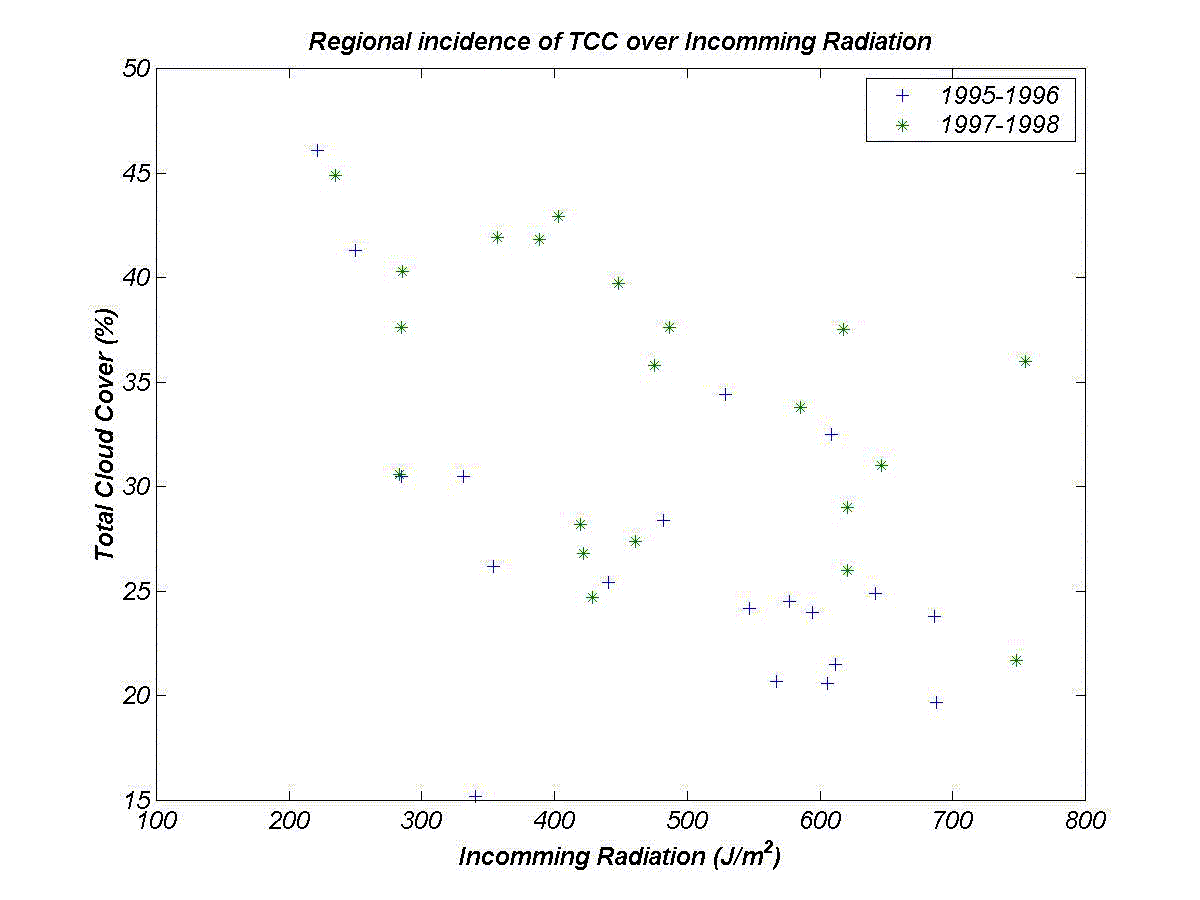
- Correlation for normality period: -52%
- Correlation for anomalies: -78% .
Figure 10 - Comparison between ABL Height and Local VR radiation data
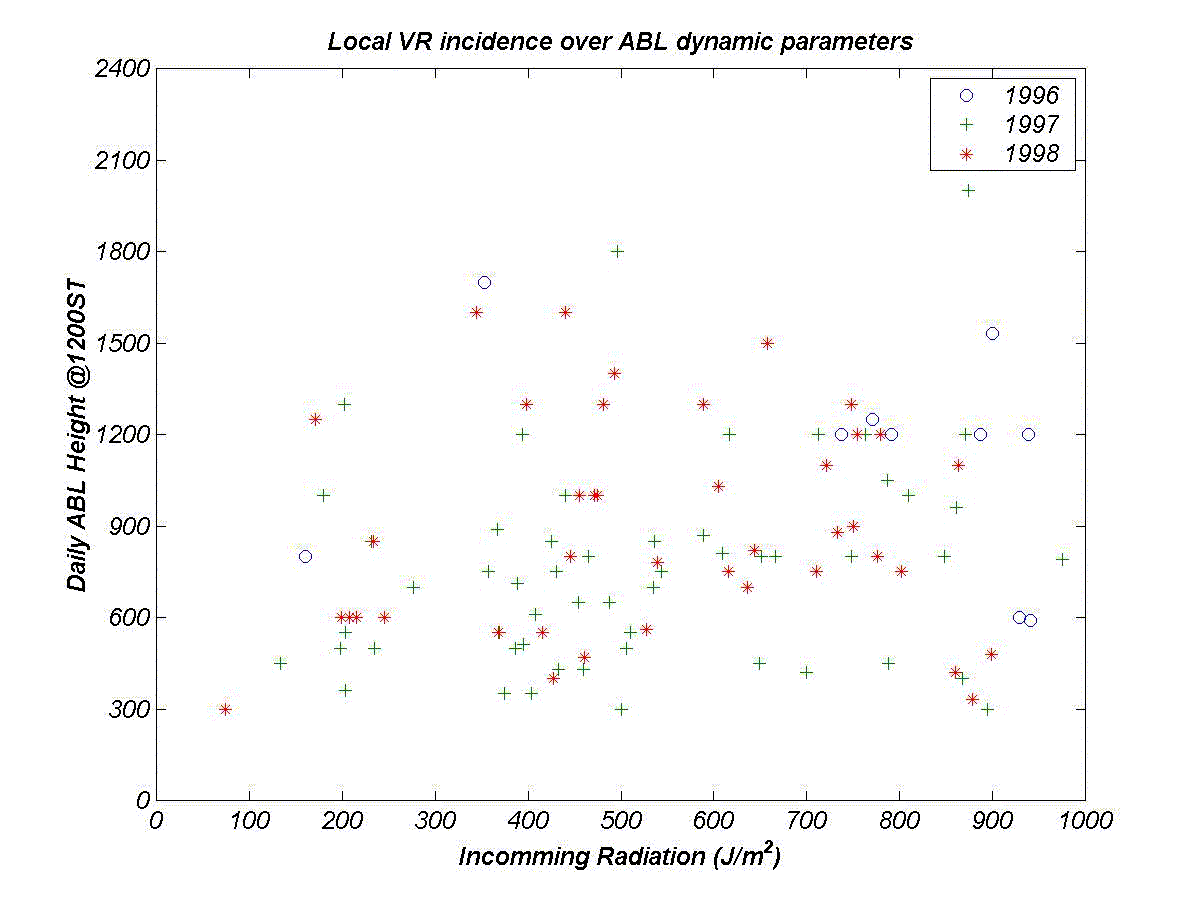
- Correlation for 1996: 18.0%
- Correlation for 1997: 34.5%
- Correlation for 1998: 17.2%