Previous: Downward propagation Next: The wave forcing Up: Ext. Abst.
Connection to the troposphere
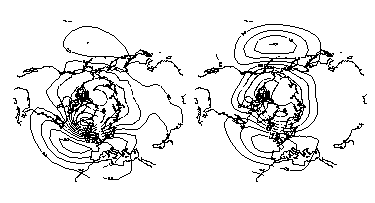
Figures 3 and 4 compare the GCM with the annual cycle to the NCEP reanalysis. A Principal Component Analysis has been performed of the sea-level pressure in the model and the reanalysis. The region north of 20 N is included and the data are weighted with the square root of the area they represent. The resulting leading EOFs (Fig. 4) are very similar and display the now familiar signature of the Arctic Oscillation: a dominantly annual, circumpolar structure with the node around 60 N and maxima over the Atlantic and Pacific oceans. In the model the two maxima have approximately the same strength while the Atlantic center is strongest in the reanalysis. Both model and reanalysis agree on the weakness of the pattern over the central part of the Eurasian continent and the displacement of the negative polar center towards the North Atlantic region. The leading EOFs in the model and reanalysis explain 14 and 23 % of the total variance.
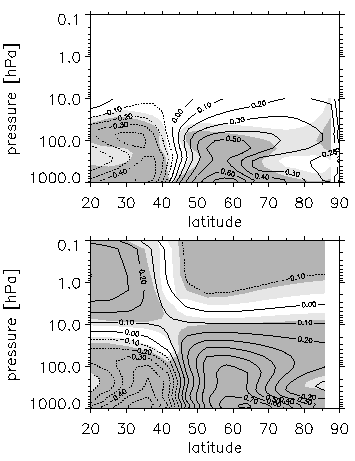
Figure 3 shows the correlations between the first principal component of the surface pressure and the zonal mean zonal winds in the meridional plane. Below 10 hPa both model and reanalysis display the dipole structure known from other studies with the cross-over between negative and positive correlations near 45 N. In the model the correlations change sign above 3-4 hPa north of 45 N and above 10-20 hPa south of 45 due to the downward propagation of anomalies: when positive anomalies reach the surface negative anomalies dominate the upper stratosphere.

Figure 3 Correlations between the zonal mean zonal wind and the first principal component of the surface pressure. Top panel is the reanalysis and lower panel is the model.

Figure 4 The leading EOF of the surface pressure in the reanalysis (left) and the model (right). These modes explain 14 and 19% of the total variance. The scaling is arbitrary.