Previous: Introduction Next: Connection to the troposphere Up: Ext. Abst.
Downward propagation
Downward propagation of zonal mean zonal wind anomalies is found in a hierarchy of models as well as in the NCEP reanalysis. Figure 1 shows zonal mean zonal wind anomalies as function of height and time for a minimal model (see below), the Holton-Mass model, a perpetual January GCM experiment, a GCM experiment with the annual cycle, and the NCEP reanalysis. For the GCM experiment and the reanalysis 60N is selected. For the simplistic models the parameters are chosen to represent northern hemisphere winter.
The downward propagation is obvious in all the plots. In the simplistic models the vacillations have a regular recurrence: the termination of one event near the lower boundary is followed by the birth of a new event near the top of the model. In the GCM the vacillations are more irregular, in particular when the annual cycle is included. In both the GCM including the annual cycle and in the reanalysis very little variability is seen in the half-year from May to October. In the half-year from November to April the variability is considerable. All winter half-years show at least one event of each sign while a few show two or more such events. In both GCM and reanalysis the events often reach the surface.
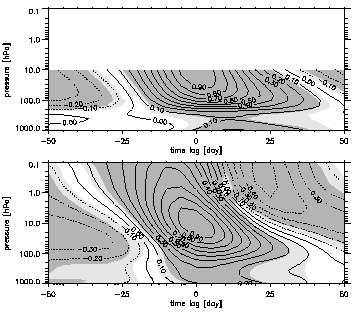
The average properties of the downward propagation in the GCM with the annual cycle and the reanalysis are captured in Fig. 2 which shows the lagged correlations between the zonal mean zonal wind at 60 N ,10 hPa and the zonal mean zonal wind at all other levels at 60 N. Correlations significant on the four sigma level reach the surface in both model and reanalysis and the time of propagation from 10 hPa to the surface is about 15 days. In the model it takes additional 10 days for the events to propagate from 0.1 hPa to 10 hPa.

Figure 2 Correlations of the zonal mean zonal wind at 60 N with that at 10 hPa as function of pressure and time-lag. The upper and lower panel shows the NCEP reanalysis and the model, respectively. Light and dark shading identify regions where the correlations are significantly different from zero on two sigma and four sigma levels.
Connection to the troposphere
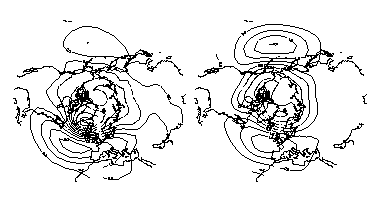
Figures 3 and 4 compare the GCM with the annual cycle to the NCEP reanalysis. A Principal Component Analysis has been performed of the sea-level pressure in the model and the reanalysis. The region north of 20 N is included and the data are weighted with the square root of the area they represent. The resulting leading EOFs (Fig. 4) are very similar and display the now familiar signature of the Arctic Oscillation: a dominantly annual, circumpolar structure with the node around 60 N and maxima over the Atlantic and Pacific oceans. In the model the two maxima have approximately the same strength while the Atlantic center is strongest in the reanalysis. Both model and reanalysis agree on the weakness of the pattern over the central part of the Eurasian continent and the displacement of the negative polar center towards the North Atlantic region. The leading EOFs in the model and reanalysis explain 14 and 23 % of the total variance.
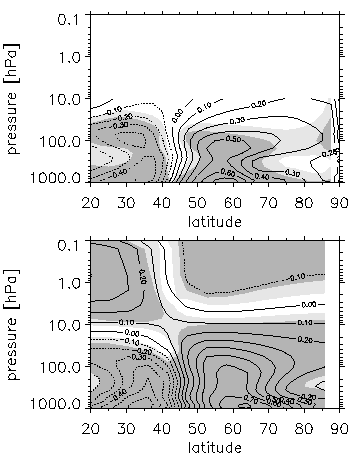
Figure 3 shows the correlations between the first principal component of the surface pressure and the zonal mean zonal winds in the meridional plane. Below 10 hPa both model and reanalysis display the dipole structure known from other studies with the cross-over between negative and positive correlations near 45 N. In the model the correlations change sign above 3-4 hPa north of 45 N and above 10-20 hPa south of 45 due to the downward propagation of anomalies: when positive anomalies reach the surface negative anomalies dominate the upper stratosphere.

Figure 3 Correlations between the zonal mean zonal wind and the first principal component of the surface pressure. Top panel is the reanalysis and lower panel is the model.

Figure 4 The leading EOF of the surface pressure in the reanalysis (left) and the model (right). These modes explain 14 and 19% of the total variance. The scaling is arbitrary.