Goddard Earth Sciences and Technology Center - Goddard Space Flight
Center, Mailcode 916 Greenbelt, MD 20771 office: Bldg. 33, E321
ph: (301) 614-6055 - fax: (301) 614-5903
Steve.Sherwood@gsfc.nasa.gov - http://hyperion.gsfc.nasa.gov/Personnel/people/Sherwood,_Steven_C.
FIGURES
Abstract
Introduction
Trends and interannual variability from radiosondes are hampered by problems of coverage and changing instrumentation. Here, both of these problems are addressed. First, a method is introduced for identifying and correcting instrumentation changes in the temperature record using day-night temperature differences. Second, a new statistical technique (iterative universal kriging) is used to overcome inconsistencies in radiosonde launch schedules and to boostinformation from stations with moderate amounts of data. Together these approaches allow temperature trends and other variations and their uncertainties to be obtained from many stations, giving spatial information. Preliminary analysis of tropical data since 1985 shows substantial cooling in the lower stratosphere but no significant change in the upper troposphere or tropopause. The stratospheric cooling shows an interesting latitude-height pattern. This work is still "in progress."
Problem in the data?
There are several shortcomings of radiosonde data that can interfere
with estimation of trends:
0) Poor, uneven coverage by sampling sites
1) Changes in instruments.
2) Irregular sampling at available sites (twice vs. once daily, changes in frequency, down periods, censoring)
Each of these can bias trends. For example, variations in data density can correlate with atmospheric variations. Changes in instrument can obviously introduce spurious trends.
Item (0) we deal with here by including as many stations aspossible; the trick then is to carefully handle (1) and (2), especially when using stations that don't report all the time. We use data from March 1985-Feb. 1999.
1. Instrument changes
This serious problem has not been addressed satisfactorily in radiosonde data, since changes are not well documented and their effects on data are hard to distinguish from natural variations (Gaffen et al, 2000). The greatest changes to thermistor instrumentation in recent times have related to contamination by solar heating of the sensor. Therefore, I tried to identify these changes based on day-night temperature differences.
Working assumptions: (1) most instrument changes thataffect temperature readings will affect day and nightreadings differently; (2) natural day-night differences (tides) should be very stable in time with insignificant trends. Additionally, we suspect that most changes will reduce daytime readings since the goal of many instrument upgrades is to reduce daytime thermistor heating. (1) remains to be tested. Autocorrelation results (not shown) support (2) at least on time-scales of a month or less.
a) Identification.
0-12Z differences (observed "tides") were found by taking the difference between soundings launched 12 hours apart, in every available pair over the 14-year record. The observed tides were examined for trends significant at the 95% confidence level. Such trends were found in 57 out of 137 tropical stations. At these "tidal shift" stations, the mostlikely time of instrument change and amplitude of the tidal shift was estimated. At 30 "non-identifiable" stations, insufficient night data was available to tell whether a tidal trend existed or not. At the remaining 50 stations, the tidal trend was indisinguishable from zero and we must assume no instrument change occurred.
Fig. 1 shows that shift amplitudes are highly, positively correlated between the troposphere and stratosphere (not the case with most natural variability), strongly indicating that they are instrumental. They also correlate with local time of day; most changes involve either a lower daytime or higher nighttime temperature after the change, consistent with anticipated reductions in solar thermistor heating.

Fig. 1. (A) Estimated tidal discontinuities at stations withstatistically significant tide trends, 50 hPa vs. 150 hPa. (B) Discontinuity vs. longitude. Within 90 deg. of the date line, a positive value indicates that daytime readings increased compared to night readings; within 90 deg. of the Greenwich meridian, the opposite. Note the tendency at all longitudes for daytime drops (or nighttime increases).
Averaged over all tropical stations, this amounts to a cooling bias of ~0.1 K/decade during this period if it is indeed due to daytime changes rather than nighttime.b) Data adjustment These trends were removed from the 57 stations simply by shifting the daytime data prior to each shift time by a constant so as to remove the spurious tidal trend. Also, the tide itself (shown in Fig. 2) was removed from all stations by adding half of it to each 12Z observation and subtracting half from each 0Z observation, rendering all observations unbiased with respect to the diurnal mean.

Fig. 2. Map of observed tide at three pressure levels. Thickness of each cross is inversely proportional to square root of uncertainty. Small white crosses indicate too little data to establish tide.
This removes spurious trends due to sensor heating changes and to variations in day-night data availability. It may not remove biases in the climatology, nor any spurious trends in both day and night readings due to these or other instrument changes ("uniform discontinuities"). Also, the 30 stations that were not identifiable may still have sensor heating trends and should be viewed with greater caution.
2. Irregular sampling treatment
Changes in sampling rate, or accidental interactions between sampling availability and natural variations, can also produce spurious trends at stations that do not report frequently and consistently.
The "iterative universal kriging" (IUK) method has recently been introduced (Sherwood, 2001) for coping with this situation and obtaining unbiased estimates of trends given the available data. This method was used on the adjusted data.
The usefulness of this method is apparent from Fig. 3, which compares the trends found by standard regression at each station against those obtained from IUK.

Fig. 3. Map of 50 hPa trend, standard (top) and IUK(bottom). Note the greater agreement among different stations in the deep tropics with IUK. Model simulated temperatures there vary by less than a degree zonally (Steve Pawson, pers. comm.) Most of the remaining anomalous tides in the lower panel are probably due to instrument problems not expressed in the tides.
3. Uniform discontinuities - still there
Next, we should check to see if there are remaining "uniform discontinuities" in the data. Another benefit of IUK is that the "residual" field f it estimates (basically thedeviation between the measured T and one predicted from the estimated state of large-scale variations) is advantageous in identifying sudden shifts at a station.
A subjective investigation of f revealed evidentdiscontinuities at about eight stations. Two examples are shown in Figs. 4 and 5. Each of the evident discontinuities occurred at stations with tidal shifts (coinciding to within a month or two of that shift) or at "unidentifiable" stations, which supports the working assumption (1) that most instrument changes will have a detectable tidal component.

Fig. 4. Time series of IUK temperature residual at Yap Island. Dashed
line shows time of tidal shift that had been previously estimated
and removed prior to IUK analysis. This provides evidence of shift
not only in tide but mean temperature at the same time. This shift
corresponds with reported change in instrumentation (Gaffen et
al., submitted).

Fig. 5. Time series of residual at Douala in Cameroon. This "unidentifiable" station has too few nighttime data to identify tidal shifts, but clearly shows an instrument change as did two other stations out of the 30 in this category.
4. Trend results
The results presented here are preliminary since no attempt has been made yet to remove the uniform discontinuities. However, some conclusions are insenstive to these.
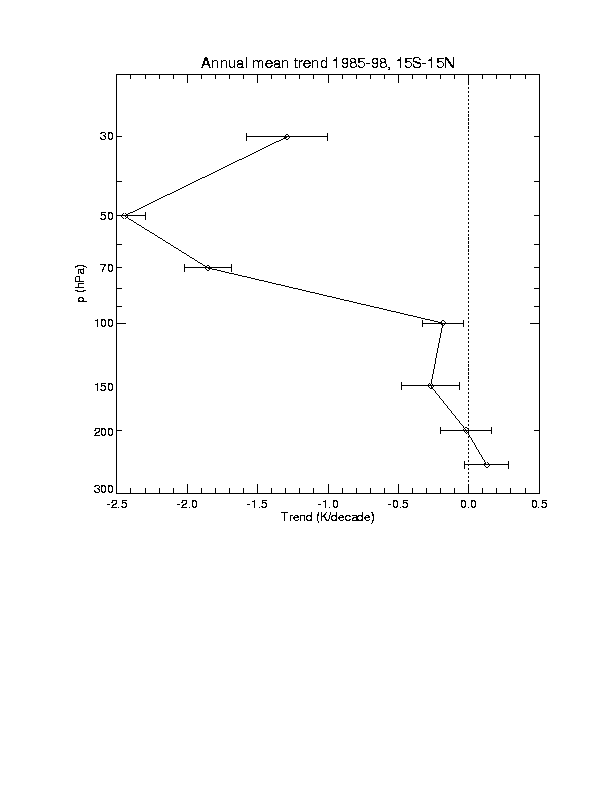
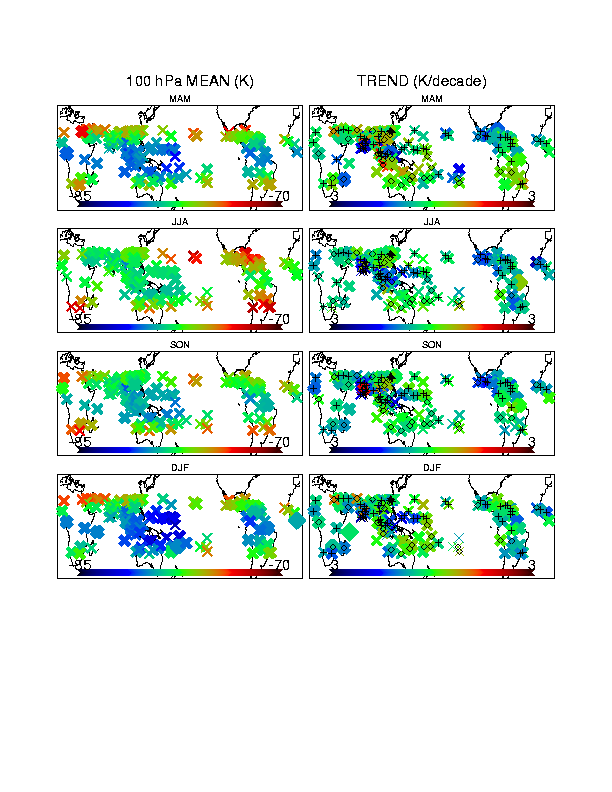
The zonal mean trend is shown in Fig. 6; a tropical mean trend profile in Fig. 7; and horizontal maps of 100 hPa trends by season in Fig. 8.

Fig. 6. Zonal mean temperature trend based on anexponential kernel of 2 degree latitude half-width. Indian stations and "unidentifiable" stations were omitted.

Fig. 7. Trend profile, 15S-15N, obtained as in Fig. 6.

Fig. 8. Map of 100 hPa trend. Thickness of crossindicates uncertainty. Diamond are plotted on top of "unidentifiable" stations. Plus sign indicates a station with a tidally-identified instrument change.
So far the trend (Fig. 7) is not distinguishable from zero at 100 hPa and below, though further work in removing the "uniform" discontinuities (which contribute about half of the indicated uncertainty) may change this. The stratospheric trend is well outside the uncertainty, and markedly discontinuous near the tropical tropopause. Reproduction of this character presents a real test for climate models. The latitude-height section (Fig. 6) shows a Mickey-Mouse Ear pattern to the stratospheric cooling in each season. I don't know why. The variations in the troposphere are probably instrumental.
The 100 hPa results are hard to interpret without further work on removing the uniform discontinuities. However, tantalizing patterns do emerge which indicate that horizontal variations in trend may well be retrievable from the data.
5. Conclusions
1) Almost half of tropical stations showed evidence of a spurious temperature shift (tidal shift) sometime during 1985-99. These are probably due to changes in solar heating of thermistors, and
(2) If so, such shifts are mostly downward and cause trends to be underestimated; average error (over all stations) at 100 hPa in tropics is ~ --0.1 K/decade.
(3) Most if not all spurious trends due to instrument changes appear detectable from tidal information (accurate quantifiability of the T-jump still questionable however).
(4) IUK method yields better information from stations with infrequent reporting. ~2 K/decade cooling in lower stratosphere occurs with curious "mouse-ear" lat/ht pattern.
(5) Sharp change from little or no T trendat 100 hPa and below, to big cooling at 70 hPa. Eventual promise of horizontal detailin trends.
Plans for the near future
Use IUK to estimate uniform shifts at the times identifiedin this analysis while re-estimating trends. This should eliminate most of remaining spurious errors, and make possible
horizontal maps of trend near tropopause.
Extend analysis to global domain (esp. poles).
Other suggestions....
References
Gaffen, D. J., Sargent, M. A., Habermann, R. E., and Lanzante, J. R., Sensitivity of tropospheric and stratospheric temperature trends to radiosonde data quality, J. Climate,13, 1776-1796, 2000.
Gaffen, D. J., R. J. Ross, J. K. Angell and G. C. Reid, Climatological characteristics of the tropical tropopause as revealed by radiosondes, J. Geophys. Res., Submitted.
Sherwood, S. C., Climate signals from station arrays with missing
data, and an application to winds, J. Geophys.Res., In press,
2001.
Back to
| Session 1 : Stratospheric Processes and their Role in Climate | Session 2 : Stratospheric Indicators of Climate Change |
| Session 3 : Modelling and Diagnosis of Stratospheric Effects on Climate | Session 4 : UV Observations and Modelling |
| AuthorData | |
| Home Page | |