Previous: Uniform discontinuities - still there Next: Conclusions Up: Ext. Abst.
4. Trend results
The results presented here are preliminary since no attempt has been made yet to remove the uniform discontinuities. However, some conclusions are insenstive to these.
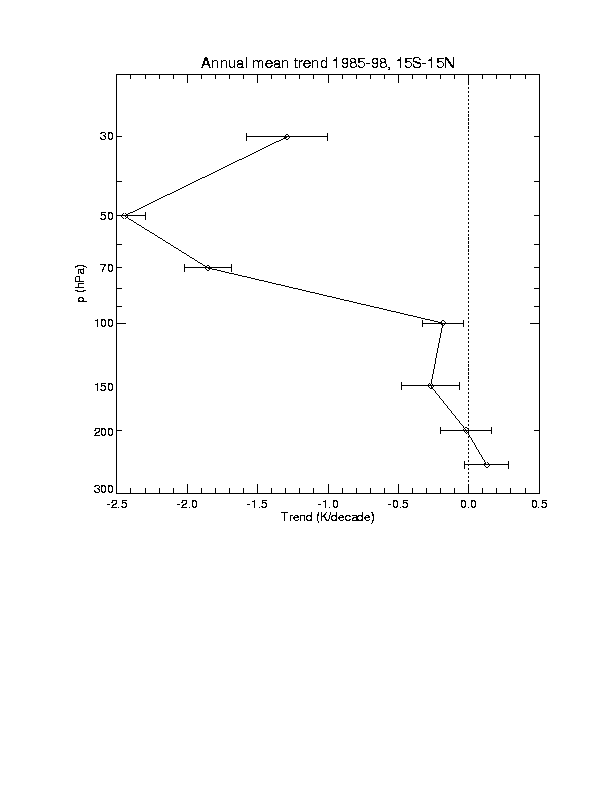
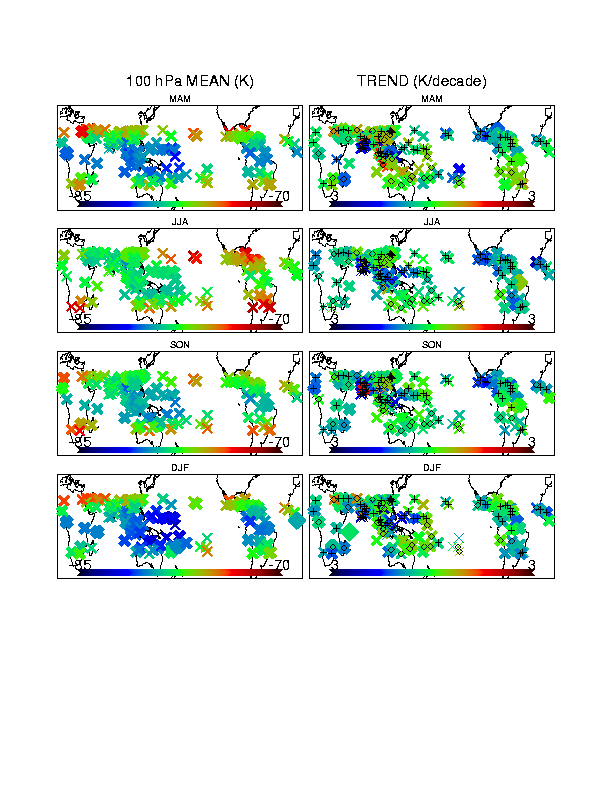
The zonal mean trend is shown in Fig. 6; a tropical mean trend profile in Fig. 7; and horizontal maps of 100 hPa trends by season in Fig. 8.

Fig. 6. Zonal mean temperature trend based on anexponential kernel of 2 degree latitude half-width. Indian stations and "unidentifiable" stations were omitted.

Fig. 7. Trend profile, 15S-15N, obtained as in Fig. 6.

Fig. 8. Map of 100 hPa trend. Thickness of crossindicates uncertainty. Diamond are plotted on top of "unidentifiable" stations. Plus sign indicates a station with a tidally-identified instrument change.
So far the trend (Fig. 7) is not distinguishable from zero at 100 hPa and below, though further work in removing the "uniform" discontinuities (which contribute about half of the indicated uncertainty) may change this. The stratospheric trend is well outside the uncertainty, and markedly discontinuous near the tropical tropopause. Reproduction of this character presents a real test for climate models. The latitude-height section (Fig. 6) shows a Mickey-Mouse Ear pattern to the stratospheric cooling in each season. I don't know why. The variations in the troposphere are probably instrumental.
The 100 hPa results are hard to interpret without further work on removing the uniform discontinuities. However, tantalizing patterns do emerge which indicate that horizontal variations in trend may well be retrievable from the data.
Previous: Uniform discontinuities - still there Next: Conclusions Up: Ext. Abst.