
Service d'Aéronomie du CNRS, Verrières-le-Buisson, France
British Antarctic Survey, Cambridge, UK
NREL, Ft. Collins, USA
FIGURES
Abstract
SAOZ UV-visible zenith-sky spectrometers measure total ozone from the ground at twilight twice a day. A network of seventeen instruments has been progressively deployed since 1988 at polar circles, mid-latitudes and tropics, for long term monitoring. Long series are now available and particular attention have been made here to provide homogeneous sets of data, taking into account instrumental and spectral analysis changes. Air-mass factors used to retrieve total columns from line-of-sight column amounts depend principally on air-density, ozone and aerosol profiles. We used available climatologies to correct retrieved total ozone from seasonal variations of ozone and temperature. Effect of volcanic aerosol is corrected using stratospheric aerosol optical thickness measurements by SAGE II during Mt Pinatubo period and using the colour index measured by SAOZ during the same period. Polar stratospheric cloud effect is corrected using SAOZ colour index measured simultaneously. Monthly means of total ozone are then analysed by the AMOUNTS numerical model for trend analysis in SAOZ series.
1. Introduction
Système d'Analyse par Observation Zénithale (SAOZ) UV-visible zenith-sky spectrometers [Pommereau and Goutail, 1988] measure total ozone twice a day at twilight from the ground. Since 1988 when the first instrument was installed at Dumont DâUrville (67¡ S, 123¡ E), a network of 17 instuments - the SAOZ network - has been deployed for global coverage and long term studies in the frame of the Network for Detection of Stratospheric Changes (NDSC). Twilight measurements are particularly adapted for observations at polar circle in winter. Twilight geometry of zenith-sky viewing enhances the path of the sunlight in the stratosphere where resides most ozone. Line-of sight amounts are larger and therefore easier to measure. These amounts are deduced from spectra by differential absorption analysis. Radiative transfer models calculate the air-mass factor (AMF) to convert line-of-sight amounts into vertical columns, the product evidently needed for scientific interpretations and for data bases. These AMFs show relatively small dependence on climatological profiles of air density, ozone and of stratospheric aerosol, so that in the past a single set of AMFs has been used for the whole SAOZ Network for all seasons and locations.
Long-term routine measurements are now available, and method and instruments are validated regularly [Hoffman et al., 1994; Vaughan et al., 1996; Sarkissian et al., 1995b; Roscoe et al., 1999]. But for the detection of trends like those usually observed for ozone, a more accurate approach is needed. As recommended in previous analysis of trends, instrumental changes must be well identified to reduce uncertainties. More, measurement artefacts like those arising from inadequate AMF computation must be corrected when possible.
The goal of this paper is to make a first evaluation of the trend in total ozone measured from the SAOZ network at Sodankyla (Finland), Zhigansk (Siberia), Observatoire de Haute-Provence (OHP, France), Tarawa (Kiribati Island), Kerguelen (Indien Ocean) and Dumont dâUrville (Antarctica), (see table 1 for details) using the long series of data available. Particular attention has been paid to homogeneous set of retrieved data taking into account instrument and spectral analysis changes. Seasonal effect on ozone AMFs will be evaluated using available climatological ozone and temperature profiles. Stratospheric aerosol effect on the AMFs will also be evaluated using SAGE II optical thickness measurements during Mt Pinatubo period as well as Polar Stratospheric Cloud effects. Corrections of these effects will be applied to SAOZ data to produce ozone monthly means.
Table 1: SAOZ series to be used here, instrumental set up and changes.
| Station |
|
|
|
|
|
|
|
|
|
|
|
| Zhigansk | 67 N | 123 E | Dec 91 | UN, 512 | Jul. 99 | ||||||
| Sodankyla | 67 N | 27 E | Feb. 90 | UP, 512 | Dec. 91 | UN, 512 | Jan. 95 | CN, 1024 |
|
|
|
| Obs. Haute-Provence | 44 N | 6 E | Jun. 92 | CP, 512 | Jun. 95 | CP, 512 | Jul. 95 | CP 1024 |
|
||
| Tarawa | 1 N | 173 E | Aug. 92 | CP, 512 | Dec. 98 | CP, 512 | Dec. 99 | ||||
| Kerguelen | 49 S | 70 E | Dec. 95 | CN, 512 | Dec. 99 | CN, 512 | Dec. 99 | ||||
|
Dumont D'Urville |
67 S | 140 E | Jan. 88 | UP, 512 | Jul. 92 | UP, 512 | Dec. 93 | CN, 1024 |
|
2. SAOZ intrument
The SAOZ instrument is a broad-band (300-600 nm), medium resolution (1.0 nm) diode-array spectrometer [Pommereau and Goutail, 1988]. Spectra are recorded every 5 minutes during twilight up to 94¡ solar zenith angle (SZA). Spectra are analysed by differential absorption spectroscopy relatively to a single reference spectrum taken with the same instrument on a clear day at low SZA. Absorptions by O3, NO2, H2O and O4 are derived by an iterative technique, as presented by Sarkissian [1992] but with updated cross-sections and improved wavelength calibration. Line-of-sight ozone, usually identified as slant ozone column (O3slant) is derived from a band 100 nm wide centred at 510 nm. Several versions of the instrument have been developed since the first in 1988 corresponding to different instrumental set up using several combinations of gratings (UFS200 and CP 200, identified as U or C in the set up), detectors (512 or 1024 pixels, PCD or NMOS, all made by Hamamatsu identified as P or M in the set up), and computers (HP or PC for new versions, only since 1999 at OHP in this study), due to progressive improvements since 1988. Table 1 gives information on the main instrumental changes for each station. For each period, main instrumental settings and data analysis are identical. Previous intercomparison campaign [Hoffman et al., 1994; Vaughan et al., 1996; Roscoe et al., 1999] have shown that the spread in ozone line-of sight amounts retrieved from different instruments is better than 1%, indicating the global agreement in the community between instruments and softwares for ozone measurements. Two software versions have been used here for the spectral analysis: one, ANA5V2 for 512 pixels instruments and the other, SAM, for the 1024 pixels version. Note that data sent to NDSC up to now are those analysed with ANA5V2 software.
Total vertical ozone columns O3vert are obtained from the line-of-sight (slant) columns O3slant, derived from the differential spectra, using the folowing relationship:
O3vert = ( O3slant+O3ref ) / AMF (1)
where O3ref is the amount of ozone in the reference spectrum. SAOZ data are vertical columns iderived from this equation and averaged between 86¡ and 91¡ SZA to minimise errors (Pommereau et al. [1991] and Van Roozendael et al. [1994]). The number of spectra at each twilight is usually about 10.
The colour index, which will be used later in this paper to evaluate the effect of aerosol on AMF, is the ratio of fluxes at 550 and 350 nm corrected from measured absorptions and normalized to 1 at 90¡ SZA to remove tropospheric contribution [Sarkissian et al., 1991; 1994]. The colour index depends on the altitude and on the optical thickness of the stratospheric scatterers: a reddening (a colour index increasing at twilight) corresponds to high altitude (24 km) geometricaly thin (1 - 3 km) and opticaly thick (>0.001) cloud. A blueing (decrease of the colour index at twilight) corresponds to a geometricaly thick (5 - 7 km) and optically thick (>0.001) low altitude cloud.
Real-time and re-analysis SAOZ programs use standard SAOZ AMF described in Sarkissian, [1992], the same set of AMF for all latitudes and seasons but calculated for 60¡N in winter.
3. Radiative transfer model
The model used here is described in Sarkissian et al., [1995b]. The single-scattering part uses the flux calculation scheme of Solomon et al. [1987]; the double-scattering part, albedo and refraction are not used in this paper. The model has been subjected to an intercomparison between different models (single scattering, Monte-Carlo, numerical integration) which shows that AMFs averaged from 86¡ to 91¡ SZA agree within ± 1% for ozone at 510 nm [Sarkissian et al., 1995a]. Sensitivities of the AMFs to vertical profiles of constituents, air density (temperature) and stratospheric scatterers (background aerosol, tropospheric cloud, volcanic aerosol and polar stratospheric cloud) is studied in Sarkissian et al. [1995b].
The radiative transfer model calculates also the colour index as defined previously for SAOZ measurements.

Figure 1: Correction to SAOZ AMF due to ozone and temperature seasonal changes for various periods and latitudes (values are from Sarkissian et al., 1995b).
4. Seasonnal variation of the AMF
Figure 1 shows the relative effect on ozone AMF due to ozone and density profiles variation during the year for high, middle and tropical latitudes. The amplitude of the variations is larger than the error due to instrumental and spectral analysis errors (1%<) but significant enough to have an effect on trend analysis and need to be corrected. This figure justify the use of SAOZ AMF for the whole network and indicate the amplitude of the biais in SAOZ ozone total column when looking at real-time data as provided for satellite or other instrumental validation. Effects of day to day variations cannot be accounted for using this method but will be reduced when making monthly averages (see below).
5. Polar Stratospheric Clouds
A PSC at 23 km with a geometrical thickness of 3 km, as it is often observed at Sodankyla in winter, changes also the AMF calculated by the radiative transfer model, as well as the colour index, as shown in previous works (Sarkissian et al., 1991, 1994, 1995b). The relationship between PSC optical thickness and effect on ozone AMF can then be related to a relationship between CI and effect on ozone AMF as shown in Figure 2. We used this relation to correct ozone AMF at Sodankyla in winter because the effect is non-negligeable, for example in January 1996 when PSCs were detected most days.

Figure 2: Correction to SAOZ AMF due to high altitude PSC occurence in winter in polar regions.
6. Volcanic aerosol
In this part, we will calculate CIs with the radiative transfer model using SAGE II aerosol profiles presented in Figure 3 (upper left panel), compare calculated and measured CI at Sodankyla from 1991 to the end of 1993 (lower left panel). Then we will make the correlation between calculated CI and correction on ozone AMF due to aerosol (upper right panel) and finally we will apply the correction (lower right panel) depending on measured CI for all stations.
Individual profiles of aerosol were measured by SAGE II between between 60¡ and 70¡ N, all longitudes from January 1990 to July 1993. (The lower and the upper parts of the profiles -not measured by SAGE II- is from the Handbook of Geophysics, 1962). Note the large scatter of the profiles above 20 km and the distinct three families of curves here: background (before September 91), high altitude (September 91 to June 92) and low altitude (after June 92) clouds. Because SAGE II was blind under the main layer of volcanic aerosol - the cloud optical thickness is too large - the lower part of high and low altitude clouds are cut off. Lower altitudes were completed with the background profile - an average of the profiles measured before the eruption- leading to an underestimation of the optical thickness of the cloud under the main layer. High latitudes only were used here because for lower latitudes, SAOZ instruments were not installed at this period (OHP) or because large SZA are not reached when instruments are too warm (Tarawa).
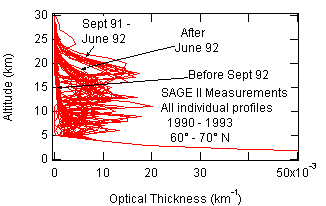
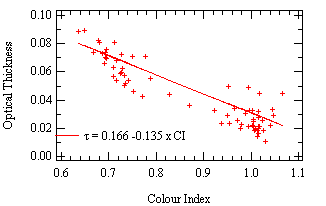
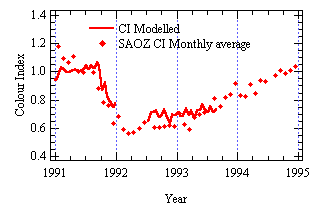
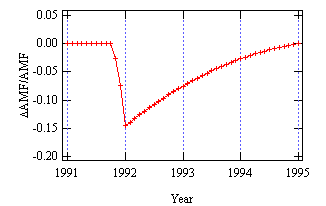
Figure 3: Correction of volcanic aerosol effect on SAOZ AMF (see text)
All these profiles were used in the radiative transfer model to calculate the colour index during this period. Before the eruption, the calculated colour index is 1.00 ± 0.03 (one sigma) and the measured colour index 1.04 ± 0.32 (calculations on daily observation basis). This large standard deviation is due to weather variations during twilight, and appearence of PSC in winter. From summer 1992 until summer 1993, measurements and calculations show a good agreement: a colour index of 0.64 ± 0.11 and 0.71 ± 0.04 respectively. The colour index measured by SAOZ is back to background conditions in summer 1994 when the cloud optical thickness was smaller than 0.004 (not shown), showing the sensitivity of the colour index method.
A correlation between colour index and optical thickness (t) can then be drawn as indicated in Figure 3 (upper right panel). This relation can be used to retrieve aerosol optical thickness from the colour index measured by SAOZ for low altitude clouds. Ozone AMFs were simultaneously calculated including volcanic aerosol measured by SAGE II. Their relative difference to SAOZ AMF is the effect of aerosol on AMF used routinely in SAOZ software. They are plotted in Figure 3 (lower right panel) versus time during Mt Pinatubo period.
7. AMOUNTS regression analysis model
General information about AMOUNTS (Adaptative MOdel for Unambiguous Trend Survey) can be found in Keckhut et al., 1995 and references therein. We used here AMOUNTS on SAOZ data corrected for above listed effects and monthly averaged. AMOUNTS is a data analysis with multiparametric adaptative model using least squares fitting. It includes Annual (AO) and semi-annual variation with sine functions, the QBO index (B. Naujokat), the NAO index: from (www.cru.uea.ac.uk, Tim Osborn Phil Jones), the temperature at 50h Pa: from ECMWF, ENSO index (ftp://ftp.ncep.noaa.gov/ , Diane Stokes and Dick Reynolds) and Solar activity: (F10.7 cm): http://www.drao.nrc.ca (F. Tapping). Results from time series are partly presented in Table 2 and in Figure 4. Instrumental changes are also evaluated using step function but they are not significant and then removed from the final analysis, indicating the quality when changing set ups of SAOZ instruments. Significant results (2s )are in bold characters. Contributions of AO, SAO, QBO, NAO, ENSO have been identified in the analysis. A significant first evaluation of the residual slope after correction of dominant effects can be provided for SAOZ longest series at Sodankyla, Tarawa and Dumont d'Urville. Significant SAO contribution in Arctic and Antarctic are due to the ozone hole at spring (larger amplitude in European than Siberian sector).
Table 2. Results of AMOUNTS on SAOZ series (see text)
| Station | Series (Month) | AO (DU) | SAO (DU) | QBO (DU) | NAO (DU) | ENSO (DU) | Variance (DU) | Residual Slope (DU/year) | DSlope (DU/year) 2s |
| Zhigansk | 85 | 76 | 4 | -4 | -2 | -2.5 | 29 | 3.3 | 6.1 |
| Sodankyla | 119 | 51 | 10 | -11 | 2 | -1.7 | 20 | 2.8 | 2.7 |
| OHP | 91 | 34 | 4 | -2 | -3 | 0.2 | 14 | -1.7 | 3.6 |
| Tarawa | 73 | 12 | 4 | 2 | 1 | 0.4 | 10 | 3.6 | 3.5 |
| Kerguelen | 49 | 38 | 4 | -17 | -1 | -1.4 | 11 | -0.4 | 5.8 |
| Dumont | 132 | 7 | 16 | 3 | 0 | 1.6 | 22 | -3.6 | 2.2 |
8. Conclusion
Long series of SAOZ measurements can now be used to start trend analysis. Methods to correct AMF seasonal variation, volcanic aerosol and PSC effects have been developed here to make a SAOZ network data set as homogeneous as possible. A first numerical analysis on selected stations have been made showing the importance of rigourus recording of instrumental history and of homogeneous spectral analysis. Results of the numerical analysis shows that contributions of AO, SAO, QBO, NAO, ENSO have been identified in the analysis. A significant first evaluation of the residual slope after correction of dominant effects can be provided for SAOZ longest series at Sodankyla, Tarawa and Dumont d'Urville. Significant SAO contribution in Arctic and Antarctic are due to ozone hole at Spring (larger amplitude in European than Siberian sector).
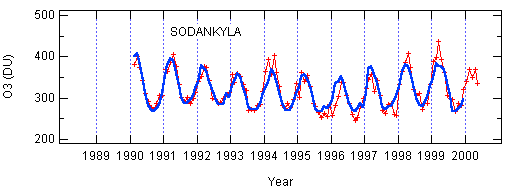
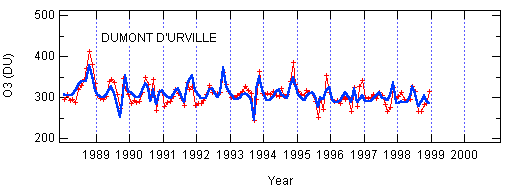
Figure 4. Results of trend analysis by AMOUNTS (thick line) on SAOZ total ozone (crosses and thin line) at Sodankyla (upper panel) and Dumont d'Urville (lower panel).
Acknowledgements.
Thanks to B. Naujokat, Tim Osborn, Phil Jones, Diane Stokes, Dick Reynolds and F. Tapping for providing data needed to run AMOUNTS numerical analysis. Thanks to E. d'Almeida who developped and runned SAM sofware. This work was supported by the French National PNCA project DETES.
References
Hoffman D.J. et al., Intercomparison of UV/visible spectrometers for measurements of stratospheric NO2 for the Network for the Detection of Stratospheric Changes, J. Geoph. Res., 100, 16765-16791, 1995.
Keckhut, P., Hauchecorne, A. and Chanin, M.-L., Midlatitude long-term variability of the middle atmosphere: Trends and cyclic and episodic changes, J. Geophys. Res., 100, 18887-18897, 1995.
Pommereau J.P. and F. Goutail, O3 and NO2 ground-based measurements by visible spectrometry during arctic winter and spring 1988, Geophys. Res. Lett. , 15, 891-894, 1988.
Roscoe H.K. et al., Slant column measurements of O3 and NO2 during the NDSC intercomparison of zenith-sky UV-visible spectrometers in june 1996, J. Atmos. Chem., 32, 281-314, 1999.
Sarkissian A., J.P. Pommereau, F. Goutail and E. Kyro, PSC and volcanic aerosol observations during EASOE by UV-visible ground-based spectrometry, Geophys. Res. Lett., 21, 1319, 1994.
Sarkissian A., J.P. Pommereau and F. Goutail, Identification of polar stratospheric clouds from the ground by visible spectrometry, Geophys. Res. Lett., 18, 779-782, 1991.
Sarkissian A., Observation depuis le sol des nuages et des poussières dans l'atmosphère: Applications a la stratosphère polaire et à l'atmosphère de Mars, Thèse de Doctorat de l'Université Paris 6, 1992.
Sarkissian A., D. Fish, M. Van Roozendael, M. Gil, H.B. Chen, P. Wang, J.P. Pommereau and J. Lenoble, Ozone and NO2 air-mass factors for zenith-sky spectrometers: Intercomparison of calculations with different radiative transfer models, Geophys. Res. Lett., 22, 1113-1116, 1995a.
Sarkissian A., H.K. Roscoe, D. Fish, Ozone measurements by zenith-sky spectrometers: an evaluation of errors in air-mass factors calculated by radiative transfer models, J. Quant. Spectrosc. Rad. Trans., 54, 471-480, 1995b.
Sarkissian A., J.P. Pommereau, F. Goutail and E. Kyro, PSC and volcanic aerosol observations during EASOE by UV-visible ground-based spectrometry, Geophys. Res. Lett., 21, 1319, 1994.
Sarkissian A., J.P. Pommereau and F. Goutail, Identification of polar stratospheric clouds from the ground by visible spectrometry, Geophys. Res. Lett., 18, 779-782, 1991.
Solomon, S., A. L. Shmeltekopf and R.W. Sanders, On the interpretation of zenith sky absorption measurement, J. Geophys. Res., 92, 8311, 1987.
Vaughan G. et al., An intercomparison of ground-based UV-visible sensors of ozone and NO2, J. Geophys Res, 102, 1411-1422, 1997.
Back to
| Session 1 : Stratospheric Processes and their Role in Climate | Session 2 : Stratospheric Indicators of Climate Change |
| Session 3 : Modelling and Diagnosis of Stratospheric Effects on Climate | Session 4 : UV Observations and Modelling |
| AuthorData | |
| Home Page | |