

Previous: Polar Stratospheric Clouds Next: AMOUNTS regression analysis model Up: Ext. Abst.
6. Volcanic aerosol
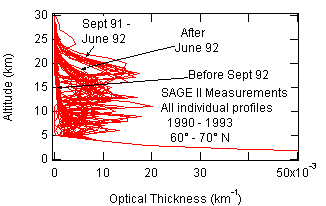
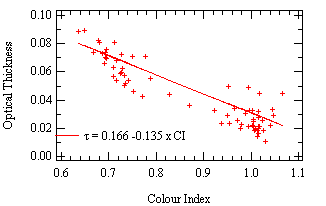
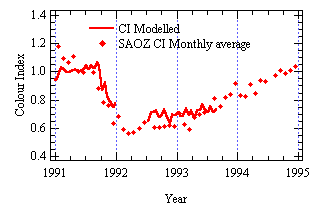
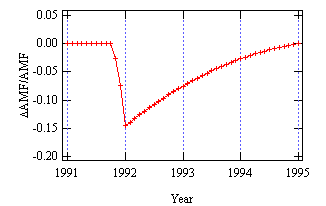
In this part, we will calculate CIs with the radiative transfer model using SAGE II aerosol profiles presented in Figure 3 (upper left panel), compare calculated and measured CI at Sodankyla from 1991 to the end of 1993 (lower left panel). Then we will make the correlation between calculated CI and correction on ozone AMF due to aerosol (upper right panel) and finally we will apply the correction (lower right panel) depending on measured CI for all stations.
Individual profiles of aerosol were measured by SAGE II between between 60¡ and 70¡ N, all longitudes from January 1990 to July 1993. (The lower and the upper parts of the profiles -not measured by SAGE II- is from the Handbook of Geophysics, 1962). Note the large scatter of the profiles above 20 km and the distinct three families of curves here: background (before September 91), high altitude (September 91 to June 92) and low altitude (after June 92) clouds. Because SAGE II was blind under the main layer of volcanic aerosol - the cloud optical thickness is too large - the lower part of high and low altitude clouds are cut off. Lower altitudes were completed with the background profile - an average of the profiles measured before the eruption- leading to an underestimation of the optical thickness of the cloud under the main layer. High latitudes only were used here because for lower latitudes, SAOZ instruments were not installed at this period (OHP) or because large SZA are not reached when instruments are too warm (Tarawa).


Figure 3: Correction of volcanic aerosol effect on SAOZ AMF (see text)
All these profiles were used in the radiative transfer model to calculate the colour index during this period. Before the eruption, the calculated colour index is 1.00 ± 0.03 (one sigma) and the measured colour index 1.04 ± 0.32 (calculations on daily observation basis). This large standard deviation is due to weather variations during twilight, and appearence of PSC in winter. From summer 1992 until summer 1993, measurements and calculations show a good agreement: a colour index of 0.64 ± 0.11 and 0.71 ± 0.04 respectively. The colour index measured by SAOZ is back to background conditions in summer 1994 when the cloud optical thickness was smaller than 0.004 (not shown), showing the sensitivity of the colour index method.
A correlation between colour index and optical thickness (t) can then be drawn as indicated in Figure 3 (upper right panel). This relation can be used to retrieve aerosol optical thickness from the colour index measured by SAOZ for low altitude clouds. Ozone AMFs were simultaneously calculated including volcanic aerosol measured by SAGE II. Their relative difference to SAOZ AMF is the effect of aerosol on AMF used routinely in SAOZ software. They are plotted in Figure 3 (lower right panel) versus time during Mt Pinatubo period.
Previous: Polar Stratospheric Clouds Next: AMOUNTS regression analysis model Up: Ext. Abst.