Previous: AMOUNTS regression analysis model Next: Acknolewdgements Up: Ext. Abst.
8. Conclusion
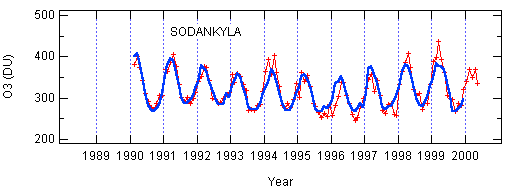
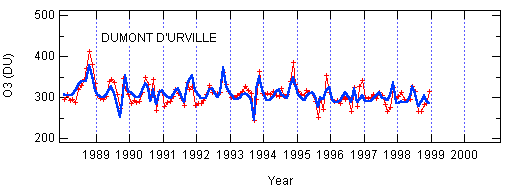
Long series of SAOZ measurements can now be used to start trend analysis. Methods to correct AMF seasonal variation, volcanic aerosol and PSC effects have been developed here to make a SAOZ network data set as homogeneous as possible. A first numerical analysis on selected stations have been made showing the importance of rigourus recording of instrumental history and of homogeneous spectral analysis. Results of the numerical analysis shows that contributions of AO, SAO, QBO, NAO, ENSO have been identified in the analysis. A significant first evaluation of the residual slope after correction of dominant effects can be provided for SAOZ longest series at Sodankyla, Tarawa and Dumont d'Urville. Significant SAO contribution in Arctic and Antarctic are due to ozone hole at Spring (larger amplitude in European than Siberian sector).


Figure 4. Results of trend analysis by AMOUNTS (thick line) on SAOZ total ozone (crosses and thin line) at Sodankyla (upper panel) and Dumont d'Urville (lower panel).
Previous: AMOUNTS regression analysis model Next: Acknolewdgements Up: Ext. Abst.