
Previous: Data Next: Case Study Up: Ext. Abst.
3. Mean Fields
3.a Stationary
Waves
In
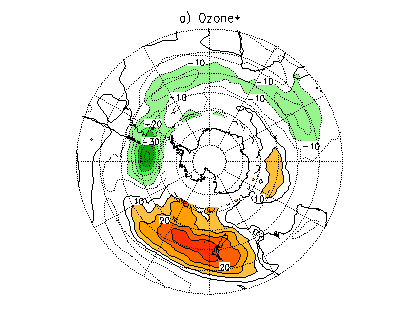
this section the basic structure of stationary waves is discussed. Figure
1a shows ozone stationary component, calculated as the difference between
July 1994 mean field and the corresponding zonal mean (denoted by "*").
South of 50ºS, ozone field depicts the typical wave number 1 that
characterises the winter season, as described by Vigliarolo et al. (2000).
Nevertheless, some differences could be appreciated. The high latitude-strong
negative center is located slightly to the west and north regarding its
climatological position and with values that are about two times greater.
On the other hand, the positive center near 50ºS, 115ºW is much
weaker (about 0.5 times) compared to climatology. Vigliarolo
et al. (2000) have suggested that winter ozone stationary pattern
over middle and high latitudes of Southern Hemisphere (SH) depends critically
on the three dimensional structure of atmospheric stationary waves, which
in turn produce ozone anomalies via both horizontal and vertical transports
(although they also caution about the main role of non-conservative processes
in contributing to ozone pattern).


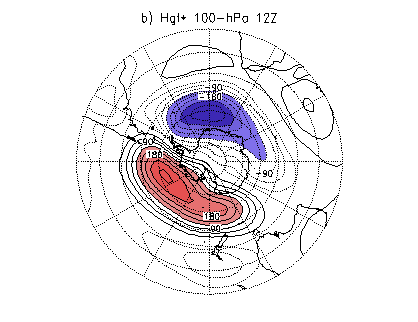
Figure 1: Zonal asymmetries
of July 1994 mean fields for a) ozone and b) 100-hPa geopotential height.
The contour interval is (a) 5 DU and (b) 50 m and the zero contour has
been omitted.
The
geopotential-height stationary wave at 100-hPa (fig.1b) also shows a wave
number 1 structure over middle to high latitudes. But, although the location
of the geopotential centers roughly coincides with the winter mean position
(see Vigliarolo et al.2000, its fig.2b), the corresponding extremes for
this particular July are more intense (about 1.8 times) and displaced towards
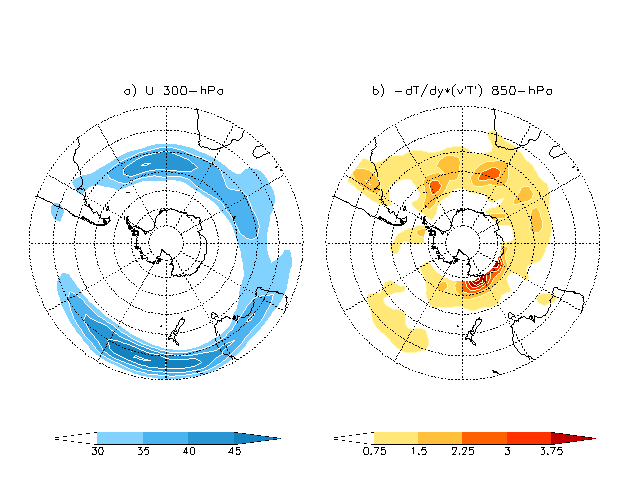
southern SA. In agreement, a westward displacement of the maximum of the
subpolar jet from the Indian Ocean to 45ºS, 15ºW and a jet weakening
along the high latitudes of Pacific Ocean are observed.

Figure 2: (a) 300-hPa
mean zonal wind (contour interval 5ms-1; only values above 30
ms-1 are shown) and (b) mean ![]() at 850-hPa (contour interval
0.75*104 ºK2 s-1).
at 850-hPa (contour interval
0.75*104 ºK2 s-1).
At
middle latitudes of both southeastern Pacific and Indian oceans, ozone
stationary pattern is related
to geopotential height via the "tropopause effect" (Vigliarolo
et al. 2000 and references therein). Moreover, a nearly continuous band
of negative ozone anomalies centered along 40ºS extends from the Atlantic
to the Central Indian Ocean and is related to geopotential positive anomalies
by the same location; in the Pacific sector, relatively high positive ozone
values are found in connection with a negative geopotential height center
near New Zealand (figs.1a,b).
3.b Transients
The
standard deviation of submonthly perturbations (constructed as the daily
departures from July 1994 time mean) was chosen to represent transient
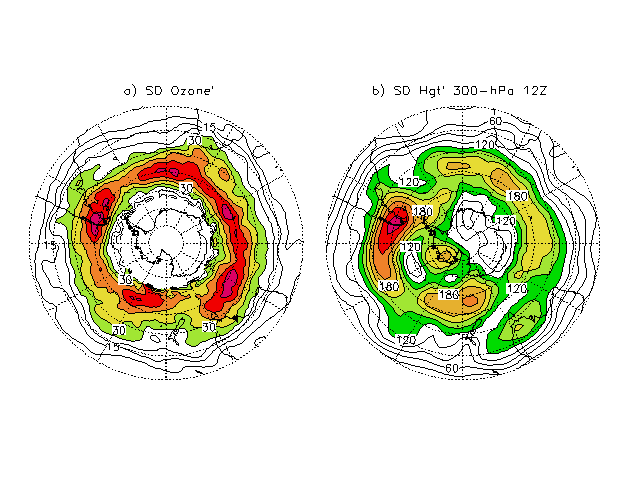
wave activity. Ozone perturbation standard deviation (fig.3a) shows large
values along the 40º-55ºS-latitude band, that roughly coincides
with maximum 300-hPa geopotential height perturbation standard deviation
maximums (fig.3b), thus confirming the main role of transients on driving
ozone variability (Salby and Callahan 1993). In addition, the high-variability
ozone centers are located poleward and maximize downstream with respect
to the geopotential-height ones (Vigliarolo et al. 2000). Over southern
SA, ozone perturbation standard deviation attains a maximum well above
the mean winter standard deviation values for the region, that is in close
association with a maximum of the geopotential-height standard deviation
located over the same area (fig.3). In agreement, a minimum of ozone over
this region of maximum submonthly wave activity is observed (fig.1a) that
persisted throughout the month in association with a quasi-stationary,
equivalent barotropic ridge centered at 55ºS, 90ºW (Figs.not
shown).

Figure 3: Standard
deviation of daily departures from July 1994 time mean of: a) ozone (contour
interval 5 DU) and b) 300-hPa geopotential height (contour interval 30
m).
Berbery
and Vera (1996) have shown that during austral winter, low level baroclinicity
attains its maximum over the subpolar jet latitudes with the highest values
located between 30º and 60ºE.
The term ![]() (where the overbar denotes time mean and (') is the daily departure from
time means, T is temperature and v is the meridional wind)
is proportional to the mean baroclinic conversion and is shown for the
20º-65º latitude band at 850 hPa (fig.2b). Note that values south
of this boundary are not plotted as it is difficult to assess the quality
of the data around and over Antarctica, where both a combination of high
terrain and steep slopes is found (Berbery and Vera 1996). In general this
field show maximums located further west than the climatology. In particular,
the displacement submonthly scale enhanced activity (fig. 3b) from its
climatological position over the Indian Ocean to the central Atlantic Ocean
seems to be associated with a conspicuous center of high baroclinicity
near 55ºS, 25ºW that extends towards the Antarctica Peninsula
(fig.2b). It is worth to point out that baroclinic conversion is not increased
over southern SA, implying that other dynamical processes not considered
here may account for the transient activity intensification over that region.
(where the overbar denotes time mean and (') is the daily departure from
time means, T is temperature and v is the meridional wind)
is proportional to the mean baroclinic conversion and is shown for the
20º-65º latitude band at 850 hPa (fig.2b). Note that values south
of this boundary are not plotted as it is difficult to assess the quality
of the data around and over Antarctica, where both a combination of high
terrain and steep slopes is found (Berbery and Vera 1996). In general this
field show maximums located further west than the climatology. In particular,
the displacement submonthly scale enhanced activity (fig. 3b) from its
climatological position over the Indian Ocean to the central Atlantic Ocean
seems to be associated with a conspicuous center of high baroclinicity
near 55ºS, 25ºW that extends towards the Antarctica Peninsula
(fig.2b). It is worth to point out that baroclinic conversion is not increased
over southern SA, implying that other dynamical processes not considered
here may account for the transient activity intensification over that region.
Previous: Data Next: Case Study Up: Ext. Abst.