Previous: Introduction Next: General Circulation Model and Design of the Simulations Up: Ext. Abst.
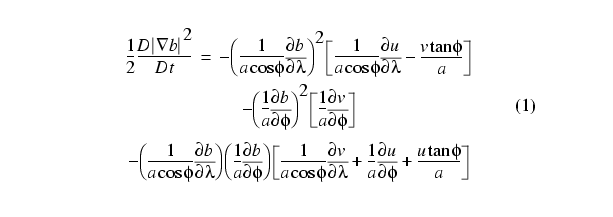
Frontogenesis is most likely to occur when a strong deformation wind field acts to increase the horizontal temperature gradient. In two dimensions (latitude-longitude), the evolution of the horizontal potential temperature (b) gradient is given by the so-called frontogenesis function (Hoskins 1982)
High values of the right-hand side of Eq. 1
at some selected vertical level can be interpreted as a possible
precursor to frontogenesis when b, u, and v are interpreted as
large scale (or resolved) fields. In the context of a numerical
simulation at relatively low resolution, frontogenesis may not
occur, but high values (greater than some selected threshold)
of the frontogenesis function could indicate that it would have
occurred at a sufficiently high resolution. The approach followed
here assumes that the frontogenesis function calculated at a single
vertical level in the troposphere suffices to determine the possible
occurrence of frontogenesis. Charron and Manzini (2000) showed
that the frontogenesis function is indeed a good front indicator
and that it can be useful as a tool for parameterizing gravity
wave sources.
The parameters that are necessary to completely specify a spectrum
of gravity waves emerging from frontal disturbances being mostly
unknown, the approach followed here is based on two empirical
evidences gathered from measurements and high resolution numerical
simulations. The first one is that bursts of high horizontal wind
variance linked to gravity wave motion is observed on the passage
of fronts (Fritts and Nastrom 1992, Eckermann and Vincent 1993),
the second one being that gravity waves are emitted, at least,
in the cross-front directions (Griffiths and Reeder 1996). Based
on these observations and high resolution idealized numerical
results, it is assumed that the total variance, the orientation
of propagation, and the launching height of the gravity wave source
spectrum are specified in the following way:
(1) At the launching level located at around 600 hPa, the right-hand
side of Eq. 1 is evaluated. This fixed launching level is chosen
a priori in the scope of representing gravity waves that are emerging
from low level fronts.
(2) If the threshold of 0.1 (K/100km)2/hour at some horizontal
grid point and time step is reached, a subgrid scale total gravity
wave wind variance of 4 m2 s-2 is imposed at that horizontal grid
point and time step. The horizontal propagation directions of
the equally bi-partitioned vertical flux of horizontal momentum
in a frame of reference moving with the flow are chosen to be
given by the two cross-front directions.
(3) If the threshold is not reached, an isotropic total gravity
wave wind variance of 0.64 m2 s-2 is instead imposed with the
aim of representing other possible gravity wave sources.