Max-Planck-Institut fur Meteorologie, Hamburg, Germany.
FIGURES
Abstract
Current parameterizations of the gravity wave processes that are relevant to middle atmosphere general circulation modeling need to have specified somewhere in the lower atmosphere a number of characteristics of the gravity wave spectrum that arise from different possible gravity wave sources (i.e. the so-called gravity wave source spectrum). The aim of this work is to take into account in the specification of the gravity wave source spectrum a space and time modulation of the gravity wave wind variance and propagation directions associated with the occurrence of frontal systems. Given that fronts are poorly resolved at the truncations commonly used in middle atmosphere models (T30 or T42), first a method is devised to diagnose conditions that are considered to be the precursor of frontogenesis in a space and time dependent low resolution flow. This is achieved by evaluating horizontal isotherm compression due to flow deformation and convergence. Second, when particular conditions are satisfied, the precursor to frontogenesis is used as an indicator of subgrid scale gravity wave emission in the model. Third, the wind variance and the propagation directions of the gravity wave source spectrum are specified according to empirical evidences of frontal generation of gravity waves. The model middle atmosphere response to this gravity wave forcing is presented. We restrict our study to fronts since they are thought to be one of the major non-stationary gravity wave sources in the extra-tropics, other gravity wave source mechanisms being left for later examination.
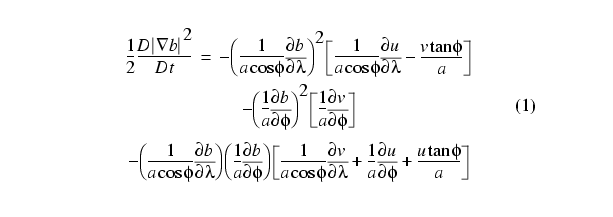
Frontogenesis is most likely to occur when a strong deformation wind field acts to increase the horizontal temperature gradient. In two dimensions (latitude-longitude), the evolution of the horizontal potential temperature (b) gradient is given by the so-called frontogenesis function (Hoskins 1982)
High values of the right-hand side of Eq. 1
at some selected vertical level can be interpreted as a possible
precursor to frontogenesis when b, u, and v are interpreted as
large scale (or resolved) fields. In the context of a numerical
simulation at relatively low resolution, frontogenesis may not
occur, but high values (greater than some selected threshold)
of the frontogenesis function could indicate that it would have
occurred at a sufficiently high resolution. The approach followed
here assumes that the frontogenesis function calculated at a single
vertical level in the troposphere suffices to determine the possible
occurrence of frontogenesis. Charron and Manzini (2000) showed
that the frontogenesis function is indeed a good front indicator
and that it can be useful as a tool for parameterizing gravity
wave sources.
The parameters that are necessary to completely specify a spectrum
of gravity waves emerging from frontal disturbances being mostly
unknown, the approach followed here is based on two empirical
evidences gathered from measurements and high resolution numerical
simulations. The first one is that bursts of high horizontal wind
variance linked to gravity wave motion is observed on the passage
of fronts (Fritts and Nastrom 1992, Eckermann and Vincent 1993),
the second one being that gravity waves are emitted, at least,
in the cross-front directions (Griffiths and Reeder 1996). Based
on these observations and high resolution idealized numerical
results, it is assumed that the total variance, the orientation
of propagation, and the launching height of the gravity wave source
spectrum are specified in the following way:
(1) At the launching level located at around 600 hPa, the right-hand
side of Eq. 1 is evaluated. This fixed launching level is chosen
a priori in the scope of representing gravity waves that are emerging
from low level fronts.
(2) If the threshold of 0.1 (K/100km)2/hour at some horizontal
grid point and time step is reached, a subgrid scale total gravity
wave wind variance of 4 m2 s-2 is imposed at that horizontal grid
point and time step. The horizontal propagation directions of
the equally bi-partitioned vertical flux of horizontal momentum
in a frame of reference moving with the flow are chosen to be
given by the two cross-front directions.
(3) If the threshold is not reached, an isotropic total gravity
wave wind variance of 0.64 m2 s-2 is instead imposed with the
aim of representing other possible gravity wave sources.
The main reference simulation, hereafter labeled GWRF1, is carried
out with the MAECHAM4 model with the abovementionned parameterization
of the gravity wave emission from frontal disturbances applied
to the input source spectrum of the Hines parameterization (Hines
1997a,b). The GWRF1 employs T30 truncation and includes a few
other modifications to the input source spectrum with respect
to the configuration used by Manzini and McFarlane (1998). As
the GWRF1 simulation evolves, the right-hand side of Eq. 1 is
computed at each grid point and time step at the launching level
near 600 hPa in order to determine whether or not conditions favorable
to frontogenesis are met and to specify the gravity wave variance
and directions of propagation accordingly.
In addition, two sensitivity simulations have been carried out
with MAECHAM4, respectively labeled UNI1 and UNI2. They serve
as a mean of directly evaluating the impact of including a representation
of fronts in the gravity wave source. Both UNI1 and UNI2 simulations
are carried out at T30 truncations. The source spectrum of the
UNI1 and UNI2 simulations is assumed to be isotropic. The total
gravity wave wind variance at the same launching level as GWRF1
is set to 0.64 m2 s-2 for UNI1 and to 1 m2 s-2 for UNI2, uniform
in space and constant time. The UNI1 source spectrum would therefore
be identical to the one specified in simulation GWRF1 if the minimum
threshold of the frontogenesis function was never reached in this
latter simulation. The UNI2 source spectrum is very close to the
monthly zonal mean source spectrum of GWRF1 in the extra-tropics.
The results from the GWRF1, UNI1, and UNI2 simulations are each
one from 12 year integrations.
This parameterization based on resolved deformation and convergence
fields in the model middle troposphere leads to a gravity wave
source intensity that has local maxima at known storm track locations.
Moreover, a seasonal modulation of the monthly and zonal mean
total gravity wave wind variance at the model launching level
is observed with minima in summer, especially in the Northern
Hemisphere. Instantaneous values of the total gravity wave wind
variance entering the lower stratosphere seem to mimic relatively
well the wind variances calculated from measurements made by instruments
installed on commercial aircrafts.
When comparing GWRF1 to UNI1 in summer, the monthly and zonal
mean vertical flux of zonal momentum carried by gravity waves
reaching the middle atmosphere is almost unchanged when gravity
waves from fronts are suppressed, but the winter values are more
than doubled when gravity waves from fronts are parameterized.
The second sensitivity test (UNI2) consists in imposing a uniform
and constant gravity wave wind variance at launching level that
is very close to the monthly and zonal mean extra-tropical variance
observed in the simulation in which fronts are acting as gravity
wave sources. It turns out that even though the mean strength
of the gravity wave forcing and the mean characteristics of the
propagating medium in the two experiments are essentially the
same in winter, the mean negative vertical flux of zonal momentum
reaching the middle atmosphere is found to be more important when
gravity waves from fronts are present, especially at 60S in July.
This is essentially caused by the fact that tropospheric filtering
effects by critical levels are reduced when gravity waves emerge
from frontal zones since the gravity wave propagation directions
and the wind direction are generally perpendicular in the model
troposphere of GWRF1.
The mean mesospheric zonal gravity wave induced force per unit
mass of the two sensitivity experiments tends to be higher near
the model top in winter than in the GWRF1 simulation. On the other
hand, the mean winter zonal induced force per unit mass of the
GWRF1 simulation acts lower in the mesosphere than for the sensitivity
tests, in accordance with the fact that the initial amplitude
of the parameterized gravity waves emerging from frontal zones
is greater than the selected constant amplitude in the sensitivity
tests, and despite the relatively small amplitude of waves emerging
from non-frontal zones.
The seasonal modulation of the monthly and zonal mean gravity
wave wind variance at launching level in experiment GWRF1 is found
to be helpful in simulating a more realistic zonal mean middle
atmospheric jet in the Northern Hemisphere in July. During that
month, a simulation with a gravity wave forcing that is uniform
at launching level suffers from too strong middle atmospheric
jet in the Southern Hemisphere (simulation UNI1) or a slightly
too weak jet in the Northern Hemisphere (simulation UNI2). Moreover,
the observed equatorward tilt of the mean zonal middle atmospheric
jet in the Southern Hemisphere in July is more pronounced and
closer to observations in GWRF1 than in UNI1 and UNI2. Figs. 1
and 2 depict NCEP and CIRA86 zonal wind data (OBS) in January
and July, as well as the ensemble mean of GWRF1, UNI1, and UNI2.
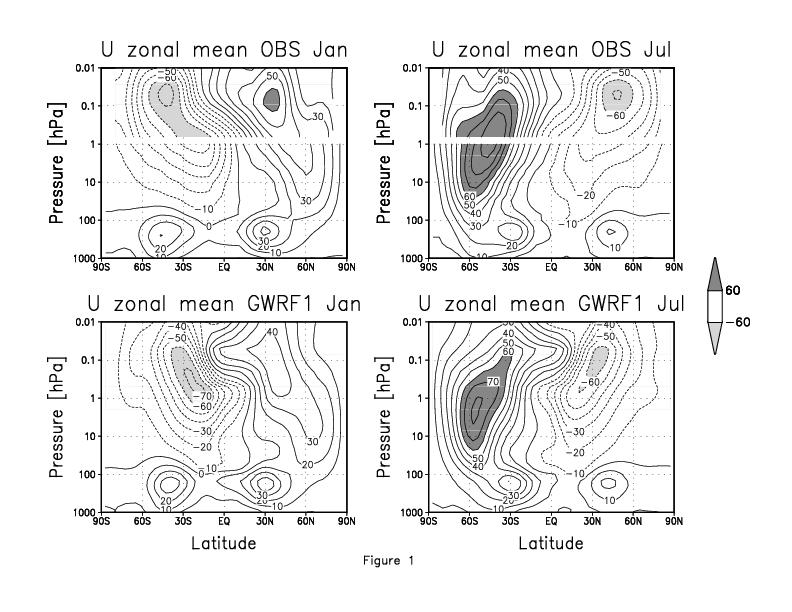
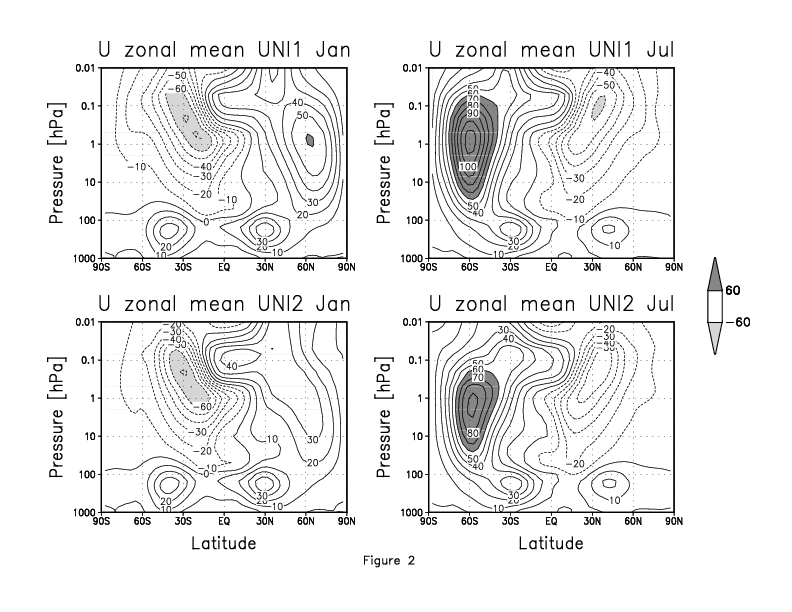
Figs. 1 and 2 depict NCEP and CIRA86 zonal wind data (OBS) in January and July, as well as the ensemble mean of GWRF1, UNI1, and UNI2. The stratospheric mean polar cold bias in the Southern Hemisphere in winter obtained in the absence of gravity waves emerging from frontal zones can reach 25--30 K near 5 hPa in simulation UNI1, but is reduced to 2--4 K when these gravity waves are included. Among the four simulations performed for this study, the temperature biases at the poles is found to be minimal when part of the parameterized gravity wave activity is modulated by frontogenesis.
The stratospheric mean polar cold bias in the Southern Hemisphere
in winter obtained in the absence of gravity waves emerging from
frontal zones can reach 25-30 K near 5 hPa in simulation UNI1,
but is reduced to 2-4 K when these gravity waves are included.
Among the four simulations performed for this study, the temperature
biases at the poles is found to be minimal when part of the parameterized
gravity wave activity is modulated by frontogenesis. Figs. 3 and
4 show the mean temperature at 87N and 87S in the stratosphere
throughout a year cycle obtained from 15 years of NCEP data. Figs.
3 and 4 also depict the difference between the three simulations
described earlier and the NCEP data. Note that part of the simulated
biases can be due to the specified ozone climatology employed
in the simulations.
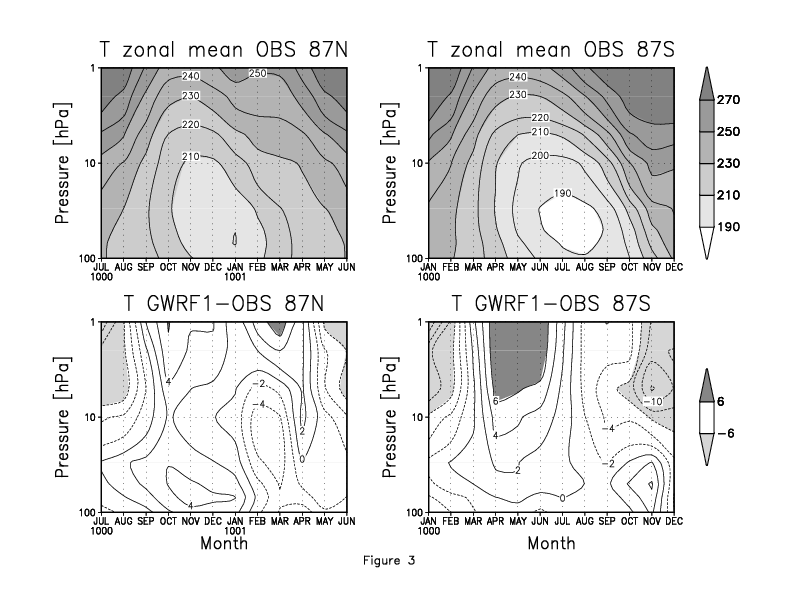
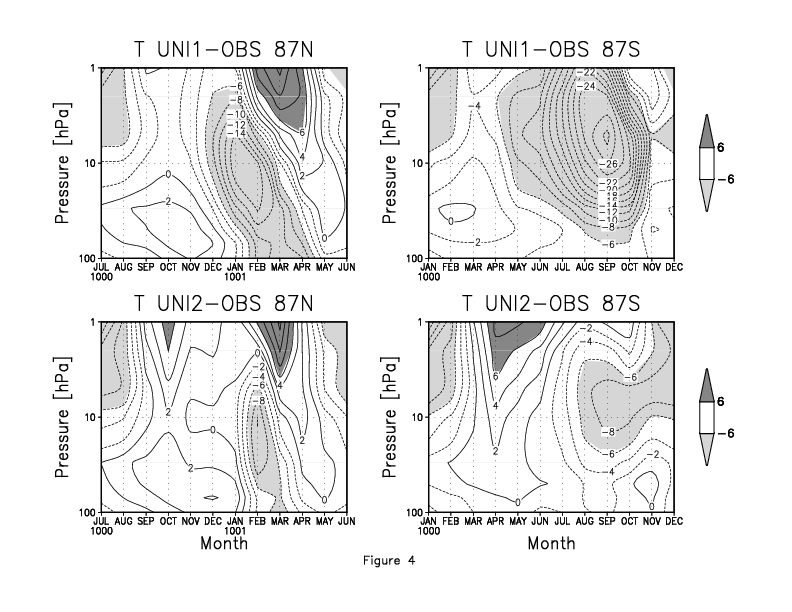
Figs. 3 and 4 show the mean temperature at 87N and 87S in the stratosphere throughout a year cycle obtained from 15 years of NCEP data. Figs. 3 and 4 also depict the difference between the three simulations described earlier and the NCEP data. Note that part of the simulated biases can be due to the specified ozone climatology employed in the simulations.
Gravity waves being a major mesospheric forcing that can greatly
impact on the stratospheric circulation, establishing a source
parameterization that is based on our dynamical knowledge of their
generation mechanisms should help in obtaining realistic simulations
of the middle atmosphere. In the MAECHAM4 model, the medium in
which parameterized gravity waves are propagating is surely very
important in determining the broad characteristics of these waves
that reach the middle atmosphere, but this study shows that a
gravity wave source spectrum that is related, even though somewhat
crudely, to dynamical a mechanism leading to gravity wave emission
can actually improve simulations of the middle atmosphere in terms
of zonal mean fields. Convective and jet stream gravity wave excitation
are mechanisms that would also need to be taken into account in
order to get a more complete picture of the impact of modulating
the gravity wave emission by relevant dynamical phenomena in middle
and upper atmospheric general circulation models.
Charron, M., and E. Manzini, 2000: Gravity waves from fronts:
Parameterization and middle atmosphere response in a general circulation
model. Submitted.
Eckermann, S. D., and R. A. Vincent, 1993: VHF radar observations
of gravity-wave production by cold fronts over southern Australia.
J. Atmos. Sci., 50, 785-806.
Fritts, D. C., and G. D. Nastrom, 1992: Sources of mesoscale variability
of gravity waves. Part II: Frontal, convective, and jet stream
excitation. J. Atmos. Sci., 49, 111-127.
Griffiths, M., and M. J. Reeder, 1996: Stratospheric inertia-gravity
waves generated in a numerical model of frontogenesis. I: Model
solutions. Quart. J. Roy. Meteor. Soc., 122, 1153-1174.
Hines, C. O., 1997a: Doppler-spread parameterization of gravity-wave
momentum deposition in the middle atmosphere. Part 1: Basic formulation.
J. Atmos. Solar-Terr. Phys., 59, 371-386.
Hines, C. O., 1997b: Doppler-spread parameterization of gravity-wave
momentum deposition in the middle atmosphere. Part 2: Broad and
quasi monochromatic spectra, and implementation. J. Atmos. Solar-Terr.
Phys., 59, 387-400.
Hoskins, B. J., 1982: The mathematical theory of frontogenesis.
Ann. Rev. Fluid Mech., 14, 131-151.
Manzini, E., and N. A. McFarlane, 1998: The effect of varying
the source spectrum of a gravity wave parameterization in a middle
atmosphere general circulation model. J. Geophys. Res., 103, 31,523-31,539.
Back to
| Session 1 : Stratospheric Processes and their Role in Climate | Session 2 : Stratospheric Indicators of Climate Change |
| Session 3 : Modelling and Diagnosis of Stratospheric Effects on Climate | Session 4 : UV Observations and Modelling |
| AuthorData | |
| Home Page | |