Laboratoire de Météorologie Dynamique du CNRS ; Ecole Polytechnique,
91128 Palaiseau cedex, France
sauvage@lmd.polytechnique.fr
FIGURES
Abstract
Introduction
Cirrus clouds play a key role in the atmospheric radiative budget.
Radiative balance depends strongly on their optical and microphysical
properties, as the ice water content, their crystal habit and
size (Stephens, 1990). It is of capital importance to understand
the processes that control these properties at all scales.
Mid latitude cirrus have very often been observed in the presence
of high and strong winds and polar fronts (Conover, 1960). In
the tropics, Sassen et al. (1989) have shown a close correlation
between the occurrence of cirrus clouds and the presence of a
subtropical jet stream. More recently, using lidar data, Mace
et al. (1995) described the formation of a cirrus deck linked
with an upper troposphere strong wind event over the United States.
Cirrus clouds formed at the tropopause height are very cold (less
than 60°C) and seem to contain smaller ice particles than lower
and warmer cirrus layers. Then they form more efficient absorbers
of thermal infrared radiation per unit mass of ice (Winker, 1998).
Observations of cirrus clouds by lidar are conducted since 1993
at Palaiseau, France (48°42N, 2°16E). Several cirrus cases can
be linked with the presence of strong jet streams. We describe
below the observations made from the 5 to the 11 of October 1994.
We observe a high correlation between the increase of tropopause
height and the elevation of the top of the cirrus cloud layer
when crossing the jet axis from the cyclonic (cold) side to the
(warm) anticyclonic side. Using AVHRR infrared data and ECMWF
reanalysis, we describe the large scale formation of cirrus clouds.
We use the conceptual patterns defined by Keyser and Shapiro (1986)
to explain the ageostrophic circulations in the vicinity of the
baroclinic areas. Terms of entrance and exit will stand for a
confluence (diffluence) area at the beginning (the end) of a jet
streak zone. Accelerations of a straight jet stream in absence
of any thermic advection are associated with direct ageostrophic
transverse circulations (i.e. normal to the jet axis). The opposite
effect is produced (deceleration and indirect transverse circulation)
in the exit area. As described by Eliassen (1962) and Shapiro
(1981) the existence of cold or warm air advection would shift
the circulation toward the anticyclonic or cyclonic side depending
of the location (entrance or exit) and the sign of the advection
(positive for cold air, negative for warm air). For instance,
the effect of cold advection in entrance would shift the direct
circulation toward the anticyclonic side of the jet stream and
then move and increase the subsiding branch of the circulation
below the jet core. This would lead to a deepening of the tropopause
fold created by the direct circulation in entrance of the jet
streak. Furthermore, a synoptic scale curvature of the jet flow
induces ageostrophic circulations along the jet axis owing an
upward branch upstream from a ridge and a subsiding branch downstream.
Other effects in the atmosphere can produce ageostrophic circulations,
but we will only take these two main effects into account in this
work.
Case study of the 6 of October 1994 shows a large cirrus deck
in the vicinity of a strong polar jet stream in an anticyclonic
long wave system over Europe. Several jet streaks areas are formed
in the jet flow.
Firstly, we will describe the synoptic conditions at the surface
and 300hPa level. Then, We will present the local measurements
of lidar and radiosoundings over Palaiseau. The third part will
be devoted to the study of ageostrophic circulations and the link
between vertical motions and cirrus formation.
1. Equipment
The backscatter lidar used at Palaiseau includes a Nd/Yag pulsed
laser Quantel 481 (wavelengths :1064 and 532 nm, energy per pulse
: 250 mJ at 532 nm, pulse duration : 12ns, frequency: 10Hz, beam
divergence : 0.7 mrd). Telescope field of view is 3mrd. Its vertical
axis is tilted 5 degrees of the zenith in order to avoid specular
reflexion by oriented ice plates. Parallel and cross polarized
signals are detected at 532 nm. Lidar signal inversion is made
using usual methods described in Elouragini (1995) or Young (1995).
Thermodynamical parameters (temperature, wind speed and direction,
relative humidity) are collected from local radiosondes launched
at 0000 and 12000 UT every day from the METEOFRANCE station of
Trappes nearby Palaiseau.
We also use AVHRR data for radiance measurements in IR channels.
Hence, ECMWF data are used to draw divergence field maps and to
calculate ageostrophic velocities and potential vorticity.
2. Synoptic description
The analysis of surface chart for the 6th October 1994 indicates the presence of a high over France and
the North of Spain. A low is formed over the east and west of
Norway. A second low is forming over North Atlantic (30W - 60N).
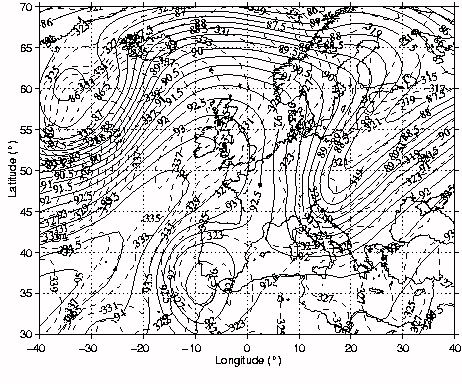
300hPa height chart (figure 1) shows a well formed ridge - trough pattern over Europe with
a straight area at the top of the ridge. A strong jet stream is
embedded in this westerly flow with a maximum speed of 72 m/s.
A jet streak is formed between Iceland and Norway (figure 2).
Figure 1 : Horizontal cross section of the atmosphere at 300 hPa. Solid lines represent geopotential lines. Dashed lines correspond to isentrops. We observe a trough on the western Europe.
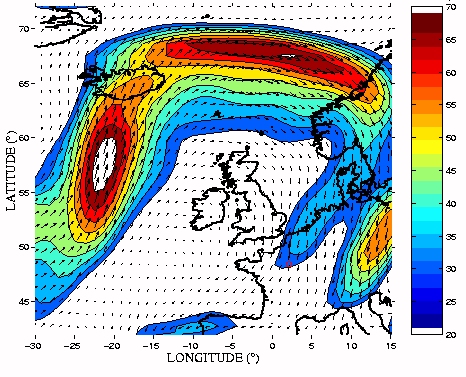
Figure 2 : Horizontal wind field at 300 hPa the 6 october 1994 at 0600 UT. The trough is drifting eastward. We see a long jetstreak called J1 at 67°N.
Cloud pattern is shown on figure 3. We observe the presence of two main cirrus formation areas west
of Iceland and over Scandinavia in the ridge.
Figure 3 : Quick look from AVHRR data in the IR 4th channel. This shows us two main cloud formation area west of Iceland and over Sweden and North Sea. We also observe an elongated branch over the Atlantic ocean corresponding to a cold front. A cirrus deck is advected southward from Sweden to France.
3. Lidar measurements
Lidar measurements have been conducted at Palaiseau from the 5th to 11th of October 1994 (Figure 4). We observed the presence of cirrus clouds during the all period
except from the 9th where the sky stayed clear during all day allowing us to observe
the stratospheric aerosol layer.
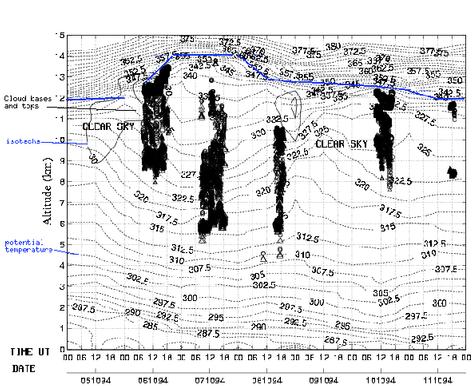
Figure 4: Isentropes (broken line) and wind speed (solid line) versus time and height interpolated from radiosondes data above Palaiseau. We ploted cirrus bases and tops retrieved from lidar data collected from the 5th to the 11th october 1994 (black rings and triangles). Thick solid line represents the tropopause height calculated from radiosoundings following the WMO definition.
Measurements from the 5th to the 7th allow us to present a good description of the cirrus cloud linked
with the cross of a polar jet streak event over Palaiseau. The
cross of a branch of a polar jet stream permits the drawing of
a vertical cross section of the jet and the warm frontal area.
We see on figure 4 the elevation of the tropopause the 6th October when crossing through the jet core from the cold cyclonic
side to the anticyclonic side. We show that cyclonic side is clear
of cirrus cloud and that cirrus form in the jet core. During the
6th, cirrus top follows the elevation of the tropopause height from
11.8 km up to 13.75 km.
We receive a very low depolarisation ratio (Figure 5, calculated as the ratio of cross polarized to parallel signal)
but no high backscatter peak from the cirrus layer forming in
the morning of 6th October that might indicate the presence of oriented crystals.
The temperature at the top is -65°C. No supercooled droplets can
exist at this temperature. Then we suppose that cloud is formed
of spheroid and very small ice particles or sulphate aerosols
in solution from volcanic origin. Depolarisation ratio increase
in this layer after a tens of minutes and reach 20 to 40% indicating
the presence of non-spherical ice crystals.
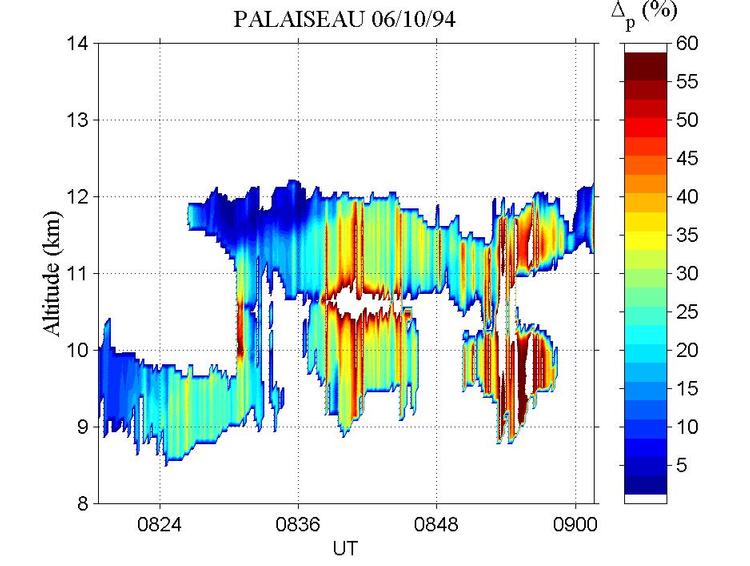
Figure 5 : Vertical profile of depolarization ratio versus time and height observed above Palaiseau on the 6 october 1994. Very low value are found at the top of this cirrus cloud around 0836.
4. Cinematic analysis
a) Divergence field
Confluence, diffluence and curvature of the streamlines govern
the divergence field. We have drawn divergence areas at 300hPa
on figure 6. We can link the divergence areas D1 and D2 with the two cirrus
decks described in section 3. These zones are created in entrance
and exit of a jet streak J1 respectively and correspond, from
the mass continuity equation to upward motion of air parcels.
D1 is formed in the anticyclonic side of the flow and D2 is formed
at the cyclonic border of the jet core.
Figure 6 : Divergence field at 300 hPa (solid filled contour lines) and
windspeed (thin solid lines) from 30 to 70 ms-1. Main divergence area are noted D1 and D2 and are located at
the entrance and exit of the jet streak J1.
b) Ageostrophic circulations
Using ECMWF reanalysis data we calculated the ageostrophic wind
field. We show on figure 7the ageostrophic circulation (ageostrophic wind Vagy and vertical wind component w) along the longitude 0°. The vertical cross section at 0000 UT
corresponds to the exit of the jet streak J1. The position of
the core of the jet is 65°N at a height between 300 and 250hPa.
We observe a direct circulation associated with the jet streak
J1. This circulation is on the equatorward side of the jet stream
and contains an ascending branch below the jet core between 60
and 65°N and a subsiding branch at 47°N in the entire depth of
the troposphere. This circulation can explain the formation of
the large cirrus deck from Sweden to France (roughly 2000km long),
with a strong lift of moistured air from below the jet and an
advection to the south before the subsiding branch.
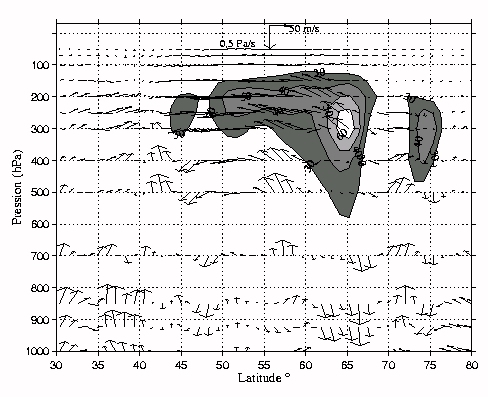
Figure 7 : Vertical cross - section of the atmosphere along the 0° longitude
on the 6 october 1994 0000 UT. Arrows represent the ageostrophic
circulation. isotachs are represented by solid lines. This cross-section
corresponds to the exit area of the J1 jetstreak. We observe at
57°N a strong upward motion between 700 hPa and the tropopause
height, up to 0,6 Pas-1.
Moreover the shift of the circulation toward the anticyclonic
side can be explained by the presence of warm advection at the
exit following Keyser and Shapiro (1986) conceptual patterns.
5. Discussion and conclusion
Cirrus observations by lidar over Palaiseau indicated the presence
of a high and persistent layer. This layer contained small particles
at the beginning of the observation period. The cirrus observed
on the 6th October 1994 is associated with the cross of a jet stream branch
over Europe. The cirrus top height follows the ascent of the tropopause
when crossing the jet core from the cyclonic toward the anticyclonic
side.
We describe the divergence field and observe the strong correlation
between the local divergence area and the coldest part of the
two main regions of cirrus formation. Vertical cross section of
ageostrophic circulations shows the motion of air masses in the
exit area of a jet streak and verifies former conceptual patterns
proposed by Shapiro.
The jet stream pattern over Europe contains two wind speed maxima
south and west of Iceland. We can link them with tropopause folds
as shown on figures 8and 9(Namias and Clapp, 1949; Donadille, 2000). Tropopause folds correspond
to stratospheric intrusion into the troposphere. In case of turbulent
mixing in the troposphere and during post volcanic period, a consequent
amount of stratospheric aerosols can be transported into the troposphere
and serve as cloud condensation nuclei. That could explain the
presence of very small particle in the cirrus cloud over Palaiseau.
Further study on this case study is currently led.
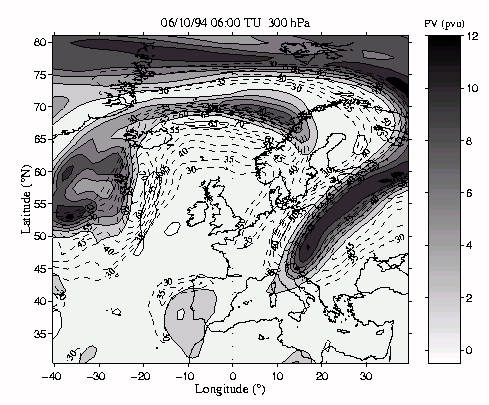
Figure 8 : Horizontal cross section of the atmosphere at 300 hPa. This figure shows the potential vorticity field over Europe at 300 hPa.
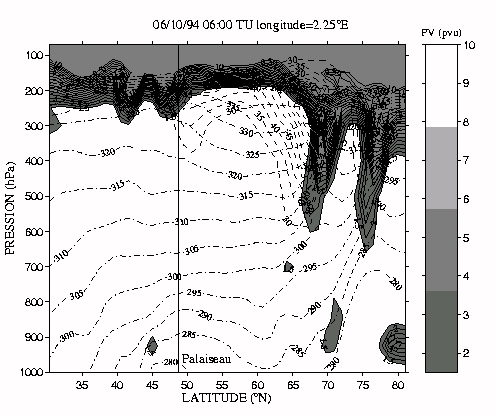
Figure 9: Vertical cross section of the atmosphere along the longitude 2°E. Dashed lines indicate isotachs from 30 to 70 ms-1. Dashed doted lines indicate isentropes. Plain lines indicates isolines of potential vorticity. We see the limit between stratosphere (gray area) and troposphere (white area). Tropopause folds are present on the northen border of jet cores. The fold falls deep into the troposphere reaching the level 600 hPa
References
Back to
| Session 1 : Stratospheric Processes and their Role in Climate | Session 2 : Stratospheric Indicators of Climate Change |
| Session 3 : Modelling and Diagnosis of Stratospheric Effects on Climate | Session 4 : UV Observations and Modelling |
| AuthorData | |
| Home Page | |