Previous: Equipment Next: Lidar measurements Up: Ext. Abst.
2. Synoptic description
The analysis of surface chart for the 6th October 1994 indicates the presence of a high over France and
the North of Spain. A low is formed over the east and west of
Norway. A second low is forming over North Atlantic (30W - 60N).
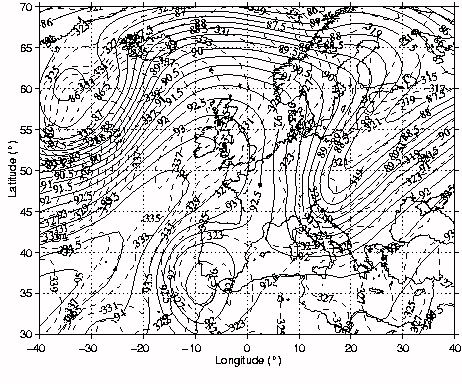
300hPa height chart (figure 1) shows a well formed ridge - trough pattern over Europe with
a straight area at the top of the ridge. A strong jet stream is
embedded in this westerly flow with a maximum speed of 72 m/s.
A jet streak is formed between Iceland and Norway (figure 2).
Figure 1 : Horizontal cross section of the atmosphere at 300 hPa. Solid lines represent geopotential lines. Dashed lines correspond to isentrops. We observe a trough on the western Europe.
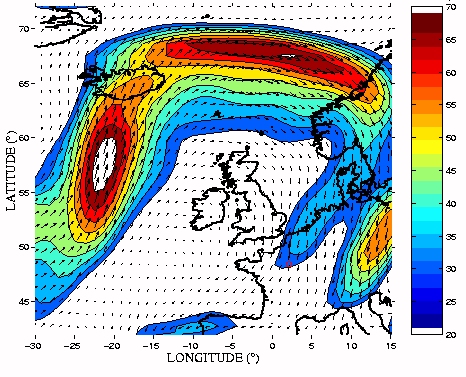
Figure 2 : Horizontal wind field at 300 hPa the 6 october 1994 at 0600 UT. The trough is drifting eastward. We see a long jetstreak called J1 at 67°N.
Cloud pattern is shown on figure 3. We observe the presence of two main cirrus formation areas west
of Iceland and over Scandinavia in the ridge.
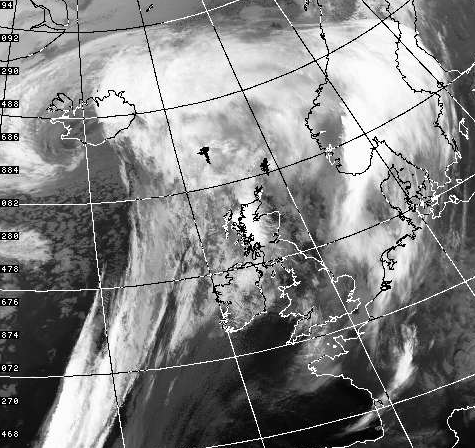
Figure 3 : Quick look from AVHRR data in the IR 4th channel. This shows us two main cloud formation area west of Iceland and over Sweden and North Sea. We also observe an elongated branch over the Atlantic ocean corresponding to a cold front. A cirrus deck is advected southward from Sweden to France.