Previous: Lidar measurements Next: Discussion and conclusion Up: Ext. Abst.
4. Cinematic analysis
a) Divergence field
Confluence, diffluence and curvature of the streamlines govern
the divergence field. We have drawn divergence areas at 300hPa
on figure 6. We can link the divergence areas D1 and D2 with the two cirrus
decks described in section 3. These zones are created in entrance
and exit of a jet streak J1 respectively and correspond, from
the mass continuity equation to upward motion of air parcels.
D1 is formed in the anticyclonic side of the flow and D2 is formed
at the cyclonic border of the jet core.
Figure 6 : Divergence field at 300 hPa (solid filled contour lines) and
windspeed (thin solid lines) from 30 to 70 ms-1. Main divergence area are noted D1 and D2 and are located at
the entrance and exit of the jet streak J1.
b) Ageostrophic circulations
Using ECMWF reanalysis data we calculated the ageostrophic wind
field. We show on figure 7the ageostrophic circulation (ageostrophic wind Vagy and vertical wind component w) along the longitude 0°. The vertical cross section at 0000 UT
corresponds to the exit of the jet streak J1. The position of
the core of the jet is 65°N at a height between 300 and 250hPa.
We observe a direct circulation associated with the jet streak
J1. This circulation is on the equatorward side of the jet stream
and contains an ascending branch below the jet core between 60
and 65°N and a subsiding branch at 47°N in the entire depth of
the troposphere. This circulation can explain the formation of
the large cirrus deck from Sweden to France (roughly 2000km long),
with a strong lift of moistured air from below the jet and an
advection to the south before the subsiding branch.
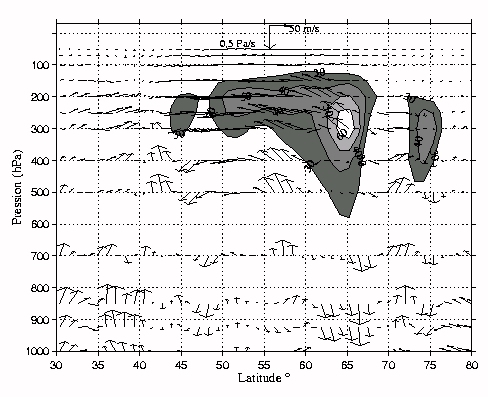
Figure 7 : Vertical cross - section of the atmosphere along the 0° longitude
on the 6 october 1994 0000 UT. Arrows represent the ageostrophic
circulation. isotachs are represented by solid lines. This cross-section
corresponds to the exit area of the J1 jetstreak. We observe at
57°N a strong upward motion between 700 hPa and the tropopause
height, up to 0,6 Pas-1.
Moreover the shift of the circulation toward the anticyclonic
side can be explained by the presence of warm advection at the
exit following Keyser and Shapiro (1986) conceptual patterns.