Previous: Overall Results Next: Multiple Comparisons at one Local Up: Ext. Abst.
Sample Comparison of Surface Observatons and UV Index
Forecasts
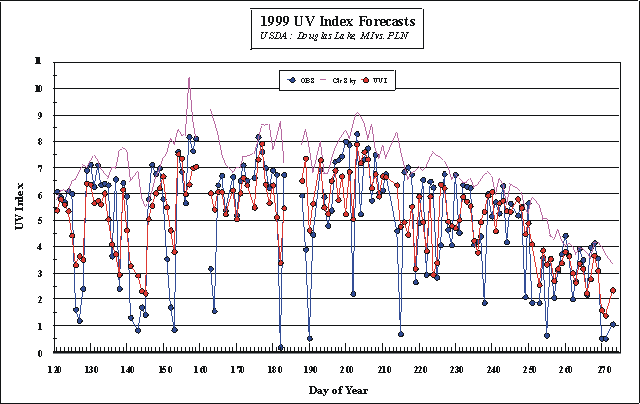
A good example of how well the UV Index forecasts and observations agree
is shown in Figure 5.

Figure 5
This figure shows how the forecasts and observations are compared "by
eye". Besides the observations and the UV Index forecasts, the "clear
sky" UV Index forecasts are also shown. This provides a indicator
of the maximum values at each particular site. The only factors affecting
this value is the solar zenith angle and the total ozone amount. Note that
the day-to-day variation of total ozone does introduce variations in the
clear sky amounts. Note also, the number of occasions when overcast conditions
occur and the large differences between observed and forecast UV Index
amounts. As explained above, the large differences that occur when overcast
conditions exist show up on the negative side of the histograms.
Previous: Overall Results Next: Multiple Comparisons at one Local Up: Ext. Abst.