Previous: Characterization Factors Next: Sample Comparison of Surface Observatons and UV Index Up: Ext. Abst.
Overall Results
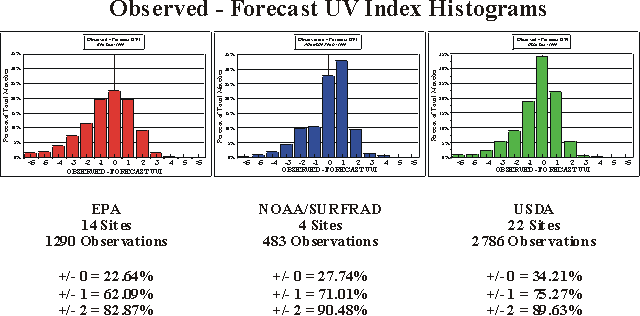
Differences between the observed and forecast UV Index values at all the sites for each of the three networks have been determined. Histograms of these differences for each of the networks are presented in Figure 4.

Figure 4
Note the high number of occurrences for the -1 to +1 UV Index differences
for the USDA and the SURFRAD. The great number of these occurrences implies
that there is great consistency between the observed and the forecast UV
Index values throughout the two networks. However, the EPA histogram results
imply a greater inconsistency between observed and forecast UV Index values
among its network sites. The high consistency for the USDA and SURFRAD
sites imply that similar differences would be expected any where the UV
Index was forecast.
The histograms also show one weakness of the UV Index forecasts. The
relatively disproportionate number of differences of negative values (-3
to -5) indicate that many times the UV Index forecasts are much greater
than the observations. As will be shown below, this occurs when overcast
conditions occur. The forecasts allows too much UV radiation to transmit
through the clouds.
Also, the SURFRAD histograms exhibit a positive bias. This is interesting since the same type of instruments are used as the USDA which exhibits no bias at all.
Previous: Characterization Factors Next: Sample Comparison of Surface Observatons and UV Index Up: Ext. Abst.