Interannual variations of planetary waves in the Southern Hemisphere
stratosphere
Isamu HIROTA
Department of Geophysics, Kyoto University, Kyoto 606, Japan
Hio Yasuko
Department of Geophysics, Faculty of Science, Kyoto University,
Kyoto 606-8502 , JAPAN
Tel: +81-75-753-3936 - E-mail: hio@kugi.kyoto-u.ac.jp
FIGURES
Abstract
1.Introduction
The seasonal march and the year-to-year variation of the stratospheric
circulation are significantly different between the northern and
southern hemispheres. In the northern hemisphere(NH), monthly
mean (steady state) planetary waves show the maximum amplitudes
in mid-winter associated with the occurrence of sudden warmings,
but in general the phase of east-west wavenumber 1 is almost fixed
due to the topographic effect of the surface.
On the other hand, planetary waves in the southern hemisphere(SH)
stratosphere show large amplitudes in late winter or early spring
(Sept.and Oct.), and the off-pole pattern of the polar vortex
which means the phase and amplitude of wavenumber 1 varies from
year to year, as can be seen in the "Antarctic ozone hole"
In view of the fact that the topographic conditions are quite
different between the two hemispheres, it is interesting to examine
the generation mechanism of planetary waves in the SH stratosphere,
as well as their interannual variability, in terms of the dynamical
coupling between the troposphere and stratosphere.
In this study a statistical analysis is made of interannual variations
of planetary waves in the wintertime SH stratosphere with the
aid of NCEP/NCAR reanalysis data-set for 20 years(1979-1998),
in conjunction with the upper tropospheric circulations such as
the mean zonal flow and short-period disturbances.
2.EOF analysis of the SH stratosphere
In order to see the year-to-year variation of the planetary waves
in the winter SH stratosphere, first we applied the EOF analysis
to the monthly mean geopotential height anomaly (deviations from
the zonal mean) of 10hPa for September and October of 1979-1998.
The result of the analysis for the set of 40 months is shown in
Fig.1.
Fig.1a gives the climatology of the 10hPa height deviation, in
which the dominance of zonal wavenumber 1 is observed with the
ridge and trough located at 150oE and 50oW respectively along
the latitude belt of about 60-70oS.
With the long-term variations of this pattern, the first component
of EOF1 (Fraction of variance 58.7%, Fig.1b) indicates the east-west
fluctuation of the phase, while the second component EOF2 (29.1%,
Fig.1c) denotes the variation of wave amplitudes as its pattern
is almost similar to Fig.1a. Note that the positive (negative)
score of EOF1 shows the westward (eastward) drift of the center
of the trough, and the positive (negative) score of EOF2 corresponds
to the increase of wave amplitudes.
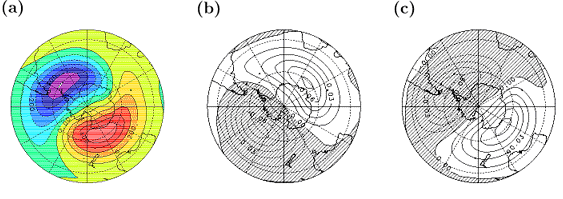
Figure 1. (a)Average of the 40 months(1979-1998 Sep,Oct) for Z* at 10 hPa
and the (b)first,(c)second mode of the empirical orthogonal function
of Z*10 .
3.Composite analysis of the upper tropospheric pattern
Next, to see the relationship between the stratospheric wave pattern
and the characteristics of upper tropospheric circulations, the
composite analysis was made of 300hPa monthly-mean zonal winds
U, together with horizontal heat flux T'v'associated with the
high-pass filtered disturbances with a time-scale less than 10
days, according to the positive and negative category of the stratospheric
EOF1 and EOF2 shown above, for September of 1979-1998. Both of
the 300hPa zonal winds and heat flux are considered to be representative
of tropospheric circulations relating to the activity of baroclinic
unstable waves.
As is shown in Fig.2a and 2b, the westward (EOF1>0) and eastward
(EOF1<0) drift of the stratospheric wave correspond to the single
and double jet structure of the upper troposphere over the eastern
hemisphere.
As for the hemispheric pattern of heat flux (Fig.2c,d), the wave
activity is dominant over the Indian Ocean in general. The difference
between the EOF1 positive and negative category is the intensity.
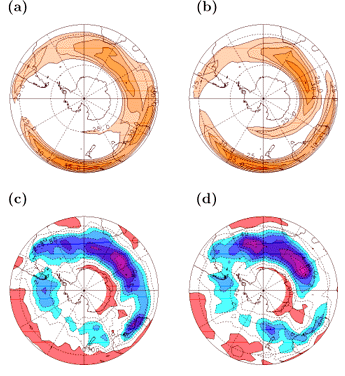
Figure 2. Composite monthly mean zonal wind U(a,b),and horizontal eddy
heat flux T'v'(c,d) for the group with the positive (a,c,),negative
(b,d) PC1 index.
Fig.3 shows the correspondence of U and T'v'to the stratospheric
wave amplitude (EOF2). The difference between the composite of
positive and negative category appears in the heat flux pattern,
not only the location of the maximum but also the intensity. This
suggests that the intensity of planetary waves in the SH stratosphere
is mainly controled by the transient troposphric waves through
their vertical energy fluxes.
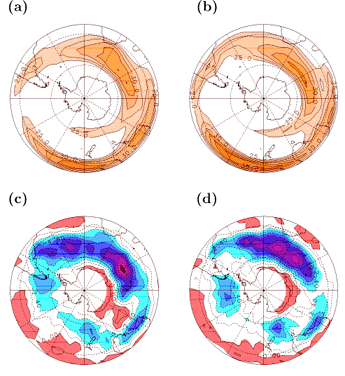
Figure 3. Same as Fig 2, but for the group with the positive (a,c),and
negative(b,d) PC2 index.
4. EOF and SVD analysis of the troposphere
In order to confirm the dynamical coupling between the troposphere
and stratosphere in more detail, we applied the EOF and SVD analysis
to the tropospheric zonal winds and 300hPa heat fluxes.
Fig.4a shows the first mode of tropospheric U (TUEOF1, Fraction
of variance 55%), which is the dipole pattern throughout the whole
troposphere, indicating the appearance of single and double jet
structure. The classification by this principal component TUPC1
sign (Fig.4b) confirms the separation of the east-west drift of
the phase of stratospheric waves.
On the other hand, the first component of 300hPa T'v' pattern
(VTEOF1, Fig.5a) reflects the wave activity over the Indian Ocean,
though the fraction of variance is rather weak (9.3%), and the
stratospheric wave intensity is clearly separated by the sign
of TVPC1 (Fig.5b).
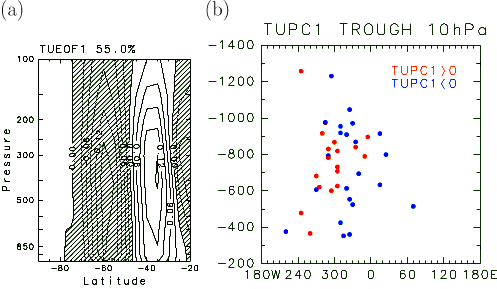
Figure 4 . Latitude height section (1000-100 hPa) of the first EOF mode
for monthly mean zonal wind averaged longitudinally for the eastern
hemisphere, (b) Scatter diagram of the value and the longitude
of the minimum Z* (trough) at 10hPa.
Red (blue) circle denotes the positive (negative) PC1 index for
zonal wind U .
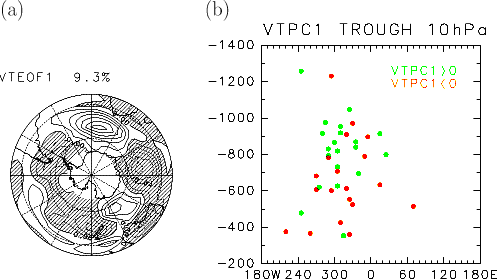
Figure 5 . Same as Fig.4 ,but (a) the first EOF mode for monthly mean
horizontal eddy heat flux at 300 hPa , (b) green (orange) circle
denotes the positive (negative) PC1 index for T'v' .
Furthermore, the result of the SVD analysis for the 10hPa height
field anomaly Z* and 300hPa T'v', though not shown here, shows
that the first and second mode explain the fluctuation of the
phase and amplitude for Z* respectively. The temporal correlation
coefficients between the expansion coefficients is high for the
first two mode.(r=0.78,0.77 ,respectively). This also confirms
the dynamical control of planetary waves in the stratosphere by
the tropospheric transient disturbances.
5.Concluding remarks
Throughout the present analysis of the NCEP/NCAR data over 20
years, some characteristic features of the interannual variations
of the wintertime SH stratosphere and their connection with the
tropospheric dynamics are found. They are summarized as follows:
i. The year-to-year variation of monthly mean planetary waves
at 10hPa can be characterized by the east-west drift of the phase,
as well as by the intensity of the wave amplitude.
ii. The variation of stratospheric wave pattern is well correlated
with that of tropospheric circulations, in such a way as the phase
with the upper tropospheric jet structure and the amplitude with
the heat flux pattern.
iii. The result of SVD analysis for the stratospheric planetary
wave and the tropospheric heat flux confirms that their year-to-year
variations are tightly connected each other.
All of these results strongly suggest that the generation and
maintenance of SH stratospheric waves are quite sensitive to the
transient wave activity in the troposphere. In this regard, the
generation mechanism for the SH stratospheric wave by the forcing
below should be further investigated, as well as the nature of
interannual variabilities in the troposphere.
Back to