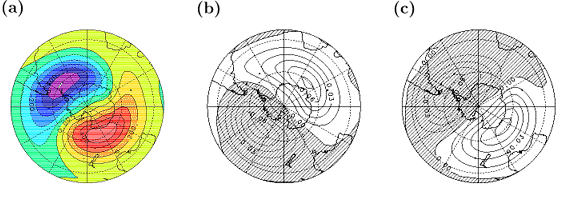
In order to see the year-to-year variation of the planetary waves in the winter SH stratosphere, first we applied the EOF analysis to the monthly mean geopotential height anomaly (deviations from the zonal mean) of 10hPa for September and October of 1979-1998. The result of the analysis for the set of 40 months is shown in Fig.1.
Fig.1a gives the climatology of the 10hPa height deviation, in which the dominance of zonal wavenumber 1 is observed with the ridge and trough located at 150oE and 50oW respectively along the latitude belt of about 60-70oS.
With the long-term variations of this pattern, the first component of EOF1 (Fraction of variance 58.7%, Fig.1b) indicates the east-west fluctuation of the phase, while the second component EOF2 (29.1%, Fig.1c) denotes the variation of wave amplitudes as its pattern is almost similar to Fig.1a. Note that the positive (negative) score of EOF1 shows the westward (eastward) drift of the center of the trough, and the positive (negative) score of EOF2 corresponds to the increase of wave amplitudes.

Figure 1. (a)Average of the 40 months(1979-1998 Sep,Oct) for Z* at 10 hPa
and the (b)first,(c)second mode of the empirical orthogonal function of Z*10 .