Previous: Extratropical and mean effects Next: Summary Up: Ext. Abst.
Morphology and driving of the QBO
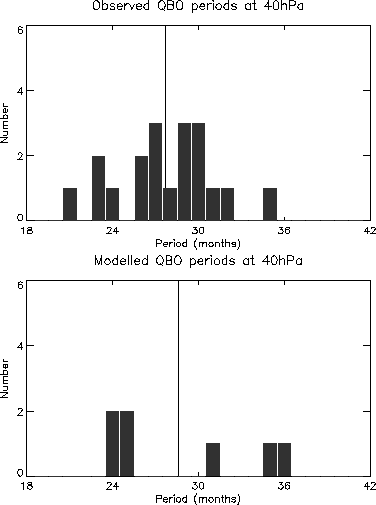
Including parametrized forces from small scale gravity waves allows a QBO to be generated in this model (Scaife et al. 2000). Figure 2 shows the zonal mean wind over the equator as a function of height for the 20 years of simulation. Variability in this field in the tropical stratosphere is dominated by the QBO. The amplitude is close to that in observations (e.g. Naujokat 1986) with easterlies up to 30m/s and slightly weaker peak westerlies of around 20m/s. The oscillation extends to the upper stratosphere where it shows significant modulation by the semiannual oscillation. The periods are shown in the histograms in Figure 3. The mean period (vertical line in Fig.3) of the oscillation in the model is close to that found in observations. The model periods also shows realistic variability with a similar range to that found in observations. There is an apparent locking to the SAO here since the periods tend to be close to multiples of 6 months.

Figure 2

Figure 3