Previous: Brief description of the Model and USSP for gravity waves Next: Morphology and driving of the QBO and USSP for gravity waves Up: Ext. Abst.
Extratropical and mean effects
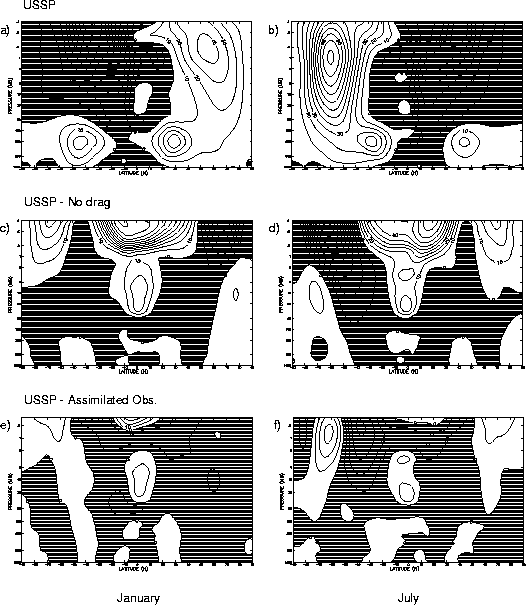
The time mean extratropical jets for January and July are shown in Figure 1. The middle panels shows the difference from a 10 year simulation without any parametrized drag and therefore represents the net effect of the USSP for gravity waves on the modelled atmosphere. The lower panels show the difference from 8 years of assimilated observational data (Swinbank and O'Neill 1994). Peak winds in the summer and winter jets are close to the observed values and the northern winter jet has equatorward tilt with height as found in observations. Note that the net effect of the USSP is comparable to the strength of the jet in many places. The southern winter jet is still more vertically aligned than the observations. There is also a large westerly forcing in the tropics, in the lower mesosphere this is a signal of an improved SAO in the model and in the stratosphere, a realistic QBO replaces the almost continuous easterlies found in prenious versions of the model (Swinbank et al. 1998, Butchart and Austin 1998).

Figure 1