Email: aascaife@meto.gov.uk
FIGURES
Abstract
We show the effects of including a spectrum of gravity waves in a middle atmosphere GCM using the U.K. Met. Office Unified model and the Ultra Simple Spectral Parametrization (USSP) of Warner and McIntyre (1999). In the extratropics, both summer and winter jets show improved strength and tilt with height when the parametrized gravity wave forcing is added. In the tropics, the model reproduces the Quasi-Biennial Oscillation with realistic amplitude, periods and phase asymmetry.
Brief description of the Model and USSP for gravity waves
The troposphere-stratosphere configuration of the Met. Office Unified Model uses 55 quasi-horizontal levels to represent the atmosphere from the surface up to 0.01hPa on a 2.5$^{o}$ by 3.75$^{o}$ latitude-longitude grid. The physical parametrizations are documented by Pope et al. (1999) and used in tropospheric climate prediction experiments. Of these parametrizations, the orographic gravity wave parametrization of Gregory et al. (1998) is applied up to the lower stratosphere and is uncoupled to the USSP. Climatological, annually varying sea-surface temperatures and atmospheric trace gases are specified and no interannual variability is imposed in the model. The USSP (see Warner and McIntyre 1999 for full details) represents the forcing from a continuous spectrum of gravity waves on the mean flow. We assume an isotropic and homogeneous wave source at the surface with 4 wavevector directions (N,S,E,W). The total launch momentum flux is 0.0066 Kg/m/s2 distributed equally between the 4 wavevector directions. The launch spectrum is continuous in vertical wavenumber (m) and is proportional to m at small m and m^-3 at large m. Assuming Coriolis effects can be ignored, the hydrostatic dispersion relation for gravity waves is used to Doppler shift the wave spectrum by the change in horizontal wind in the Unified Model as the spectrum propagates up from one model level to the next. A semi-empirical saturation limit is applied to the gravity wave spectrum after Doppler shifting and excess pseudomomentum flux is removed from the spectrum and used to calculate the wave induced force on the modelled atmosphere.
Extratropical and mean effects
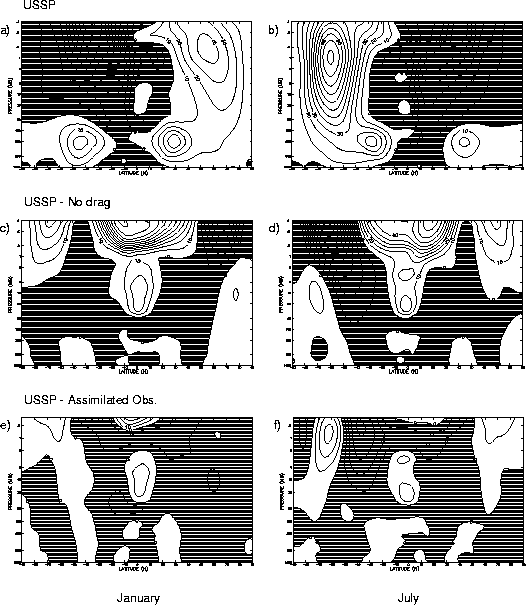
The time mean extratropical jets for January and July are shown in Figure 1. The middle panels shows the difference from a 10 year simulation without any parametrized drag and therefore represents the net effect of the USSP for gravity waves on the modelled atmosphere. The lower panels show the difference from 8 years of assimilated observational data (Swinbank and O'Neill 1994). Peak winds in the summer and winter jets are close to the observed values and the northern winter jet has equatorward tilt with height as found in observations. Note that the net effect of the USSP is comparable to the strength of the jet in many places. The southern winter jet is still more vertically aligned than the observations. There is also a large westerly forcing in the tropics, in the lower mesosphere this is a signal of an improved SAO in the model and in the stratosphere, a realistic QBO replaces the almost continuous easterlies found in prenious versions of the model (Swinbank et al. 1998, Butchart and Austin 1998).

Figure 1
Morphology and driving of the QBO
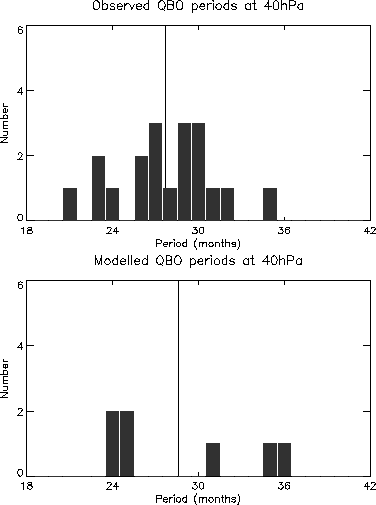
Including parametrized forces from small scale gravity waves allows a QBO to be generated in this model (Scaife et al. 2000). Figure 2 shows the zonal mean wind over the equator as a function of height for the 20 years of simulation. Variability in this field in the tropical stratosphere is dominated by the QBO. The amplitude is close to that in observations (e.g. Naujokat 1986) with easterlies up to 30m/s and slightly weaker peak westerlies of around 20m/s. The oscillation extends to the upper stratosphere where it shows significant modulation by the semiannual oscillation. The periods are shown in the histograms in Figure 3. The mean period (vertical line in Fig.3) of the oscillation in the model is close to that found in observations. The model periods also shows realistic variability with a similar range to that found in observations. There is an apparent locking to the SAO here since the periods tend to be close to multiples of 6 months.

Figure 2

Figure 3
Summary
Back to
| Session 1 : Stratospheric Processes and their Role in Climate | Session 2 : Stratospheric Indicators of Climate Change |
| Session 3 : Modelling and Diagnosis of Stratospheric Effects on Climate | Session 4 : UV Observations and Modelling |
| AuthorData | |
| Home Page | |