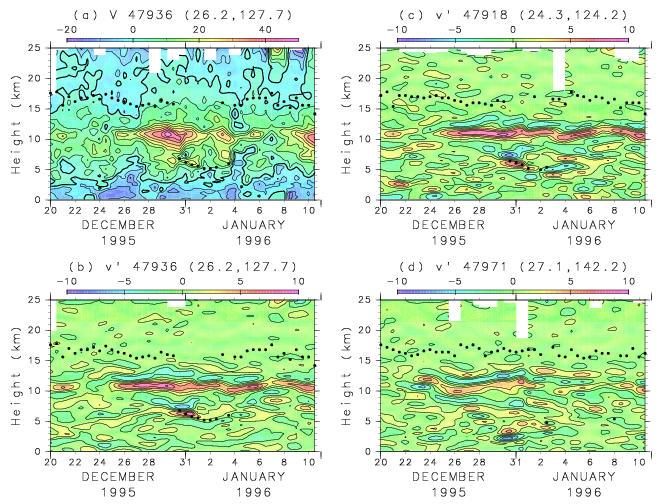
Figure 1. Time-height sections for the time period of December 20, 1995 to January 10, 1996 of (a) $v$ at Naha (26.2N, 127.7E, station No. 47936), (b) $v'$ at Naha, (c) $v'$ at Ishigakijima (24.3N, 124.2E, 47918), and (d) $v'$ at Chichijima (27.1N, 142.2E, 47971). Contour intervals are 5{\ms} ($\cdots$, -10, -5, 0, 5, 10, $\cdots$) for (a) and {\ms} ($\cdots$, -5, -3, -1, 1, 3, $\cdots$) for (b), (c), and (d). Thick contours show 0{\ms} for (a). Dots indicate the tropopause levels.
Such layered disturbances frequently appear at many stations mostly in winter. Thus, further examination is made for winter periods from 1 December through 10 March in each year. The total number of analyzed vertical profiles is 802 at each station. It should be noted that such small vertical-scale atmospheric disturbances have been analyzed mostly in terms of gravity waves so far. However, it may be needed to consider another possibility of inertial instability particularly for small-scale disturbances in low latitude regions.