Previous: Charactericstic Ozone Profiles Next: Summary Up: Ext. Abst.
3. Contribution of Waves
Vertically propagating atmospheric waves are commonly observed in the time evolution of daily radio sound data in the tropical stations. The perturbations in the tropospheric temperature and wind, supposed to be driven by atmospheric waves, are found to be more pronounced over San Cristóbal than in Singapore (Hasebe and Koyata, 2001).

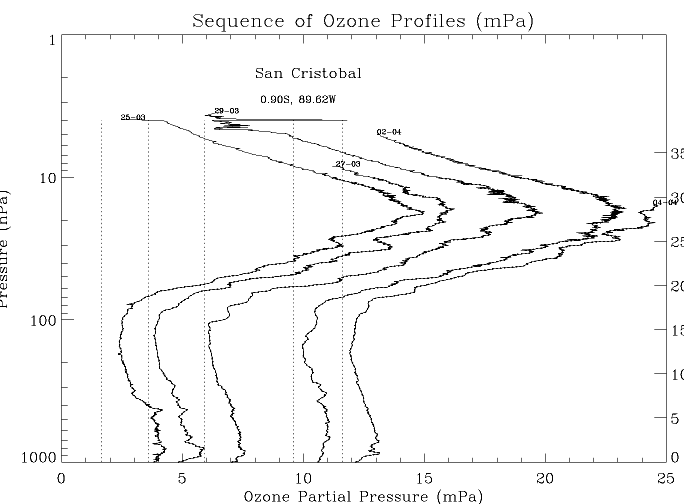
Figure 6 shows an example of such waves in San Cristóbal illustrated in the form of the sequence of ozone profiles shifted to the right hand side of the diagram corresponding to the day of observations.
It is readily seen that the ozone concentrations show wavy structure
in the vertical direction with the wavelength around one or two
kilometers. We could see the downward phase propagation of these
waves with the phase speed of about one kilometer per three days,
corresponding to the typical time scale of several days. Similar
features are also seen in potential temperature and ozone mixing
ratio both of which are pseudo conservative quantities during
the adiabatic processes associated with the wave perturbations.
When the phase of the waves reaches the tropopause, the wave structure
decays due probably to the mixing in the troposphere. Thus the
process is irreversible, representing the net downward transport
of stratospheric ozone into the troposphere. Although what we
see here would be those by gravity waves, similar processes have
been noted by Tsuda et al. (1994) and Fujiwara et al. (1998) in
the case of Kelvin waves observed over Indonesia.
What is interesting here is the role of these waves on the transport of water vapor. While the vertical gradient of the ozone is positive in the lower stratosphere, that of the water vapor is negative in the upper troposphere. This means that the similar process will bring about the negative transport of water vapor from the stratosphere to the troposphere.

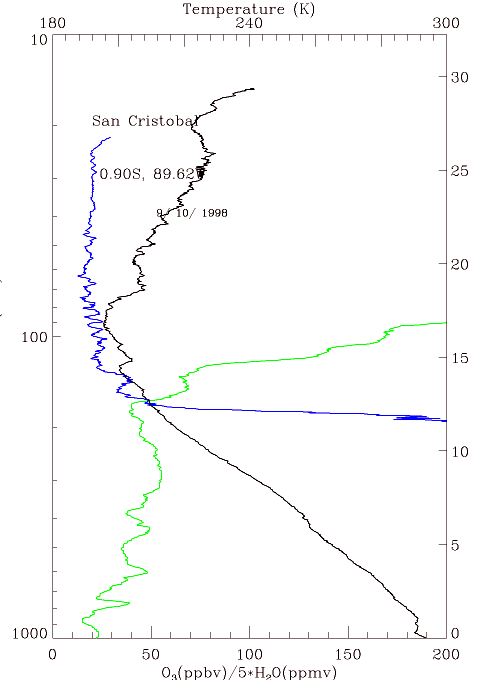
Figure 7 shows a typical profile of temperature (black), ozone (green)
and water vapor mixing ratio (blue) over San Cristóbal. It is
readily seen that the wave structure of the water vapor is out-of-phase
with that of the ozone and temperature in the region between 100
and 200 hPa. Such kind of waves are expected to work to pump the
humid air mass out from the lower stratosphere thus contributing
to keep the lower stratosphere dry as if it were a "stratospheric
draining pump."
Although the evidences shown above indicate the role of waves in small time- and vertical scales, Kelvin waves such as observed by Fujiwara et al. (1998) with larger scales may play more important role.

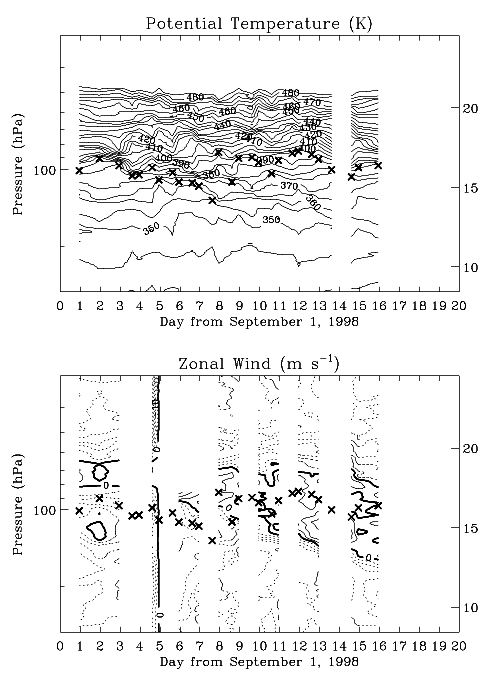
Figure 8 illustrates the time-height section of (top) potential temperature and (bottom) zonal wind during the September 1998 campaign at San Cristóbal. The crosses mark the location of the cold point tropopause.
The upward jump of the tropopause is observed at September 8, and the region of relatively high potential temperature is seen descending between the tropopause gap at a rate of about 4 km per ten days. This region corresponds to the westerly shear zone that divide the tropospheric easterlies from the lower-stratospheric westerlies. There is no systematic variation associated with this phenomenon in the meridional wind. These features are consistent with the interpretation that these perturbations are brought about by Kelvin waves. Thus the small scale features as shown in Figure 7 are embedded with the large scale variations created by Kelvin waves.

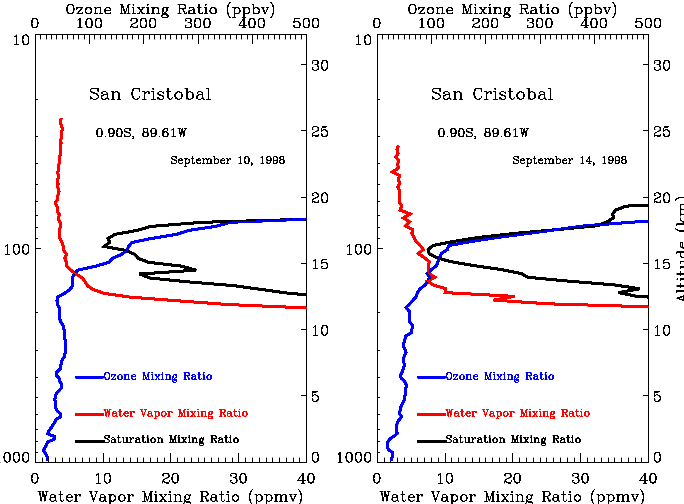
Figure 9 shows the vertical profiles of water vapor mixing ratio (red) and saturation mixing ratio of water vapor (black) calculated from observed temperature together with the ozone mixing ratio (blue) for September 10 (left) and 14 (right).
It is readily seen that the tropopause region is not saturated in September 10 while it is almost saturated in September 14 at San Cristóbal. This is an evidence that the tropopause region in the eastern Pacific in Northern summer could become saturated during the passage of Kelvin waves even though the region is relatively warm as compared to the western Pacific in Northern winter. By keeping the structure of Kelvin waves (e.g., Figure 8 of Fujiwara et al., 1998) in mind, we can see from Figure 8 that September 10 is the day when the downward displacement of the air mass is located just below the tropopause, while the displacement reaches almost highest in September 14. Since such displacement could safely be regarded as adiabatic, we could expect that the tropopause region is relatively warm due to adiabatic compression in September 10, while it is cold in September 14. Thus the saturation condition of the tropopause region is controlled by the phase of Kelvin waves. As the upward (downward) displacement associated with these waves corresponds to the cold (warm) tropopause, the air mass must be cold and dry when it enters the stratosphere and the downward motion is expected when the tropopause region is not saturated. This could be another important mechanism that keeps the stratosphere dry. It is therefore very important to estimate the role of these waves in understanding the dryness of the stratosphere.
Previous: Charactericstic Ozone Profiles Next: Summary Up: Ext. Abst.