Previous: Model validation Next: Summary and Future Plans Up: Ext. Abst.
4. Experiments
4.1 Calculations of ozone flux through the tropopause
Including extensive chemistry modules for both the stratosphere and the troposphere and applying a highly accurate transport scheme CTM-2 is well-suited for calculations of cross tropopause fluxes of ozone, nitrogen oxides, and other chemical compounds. In addition, the effect of heterogeneous chemistry in the lower stratosphere on these fluxes and on photochemistry in the troposphere can be studied. Rate coefficients for heterogeneous reactions on sulphate aerosols are calculated by the scheme of Carslaw (1995). Gamma values for the reactions on PSCs are taken from JPL (2000). Sulphate aerosol data is retrieved from SAGE observations from 1989, which was a year with a relatively clean stratosphere (corresponding approximately to 1996). The modelled distribution of PSCs is confined to latitudes higher than 50 degrees and is based on temperature thresholds for PSC formation (<197 K at heights between 90 and 40 hPa, <193 K between 40 and 20 hPa) and the assumption of NAT particles with a mean radius of 1 micron and a mean density of 10 cm-3.
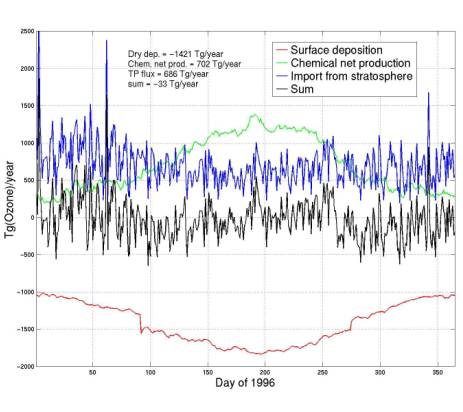
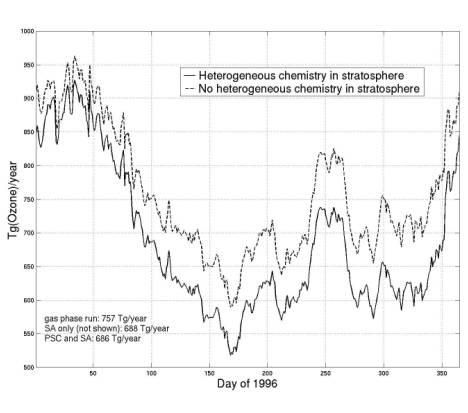
Figure 4 shows the tropospheric ozone budget for 1996 as obtained from a CTM-2 run including heterogeneous chemistry on stratospheric sulphate aerosols and PSCs. In addition (right panel) the tropopause flux is shown as a 30-day running mean, calculated in a run where heterogeneous chemistry in the stratosphere was switched off. All tropopause flux calculations use a climatological tropopause height based on NCEP data and made available at the SPARC Data Center (http://www.sparc.sunysb.edu).
Figure 4: Left panel: Tropospheric ozone budget showing diurnal means of dry deposition, import from the stratosphere, chemical net production and the sum scaled to Tg(ozone)/year. Right panel: Cross tropopause flux plotted as 30-day running mean for the run including heterogeneous chemistry and a simulation with gas-phase reactions only.
As can be seen the cross tropopause flux is increased in the absence of heterogeneous reactions due to higher ozone levels of ozone.
PSCs which cover only a small fraction of the Earth’s surface during short time periods have only little effect on the tropopause flux in this simulation: 686 Tg(Ozone)/year are calculated if both PSC and SA reactions are included, while 688 Tg(Ozone)/year is the result when PSC reactions are switched off. The effect of PSCs on the globally integrated tropopause flux is most pronounced during spring in the Southern Hemisphere. Stratospheric aerosol has global coverage and is present in all seasons. Globally integrated tropopause flux is therefore sensitive to the inclusion of heterogeneous chemistry on these particles. The right panel of Figure 4 also illustrates the dominance of the Northern Hemisphere regarding downward transport of ozone during the winter season.
4.2 Effect of aircraft emissions
As mentioned above, CTM2 includes NOx emissions from aircraft based on the ‘IPCC 2001’ (IPCC, 2001) scenario. These emissions were retrieved from the 1992 data provided by NASA and scaled up to 2000 conditions. In order to study the effect of NOx from aircraft a run without emissions from aircraft emissions was performed. Figure5 shows the increase in NOy and ozone due to aircraft emissions of NOx. Figure 6 shows the ozone net production in the UTLS region and changes resulting from aircraft emissions. NOx emissions from aircraft result in higher ozone production except for the regions where NOx levels and ozone production are modeled to have high background values (South-Eastern China).
Figure 5: Left panel: Change in zonal-mean NOy due to aircraft emissions, June 1996 [%]. Right panel: Change in zonal-mean ozone due to aircraft emissions, June 1996 [%].
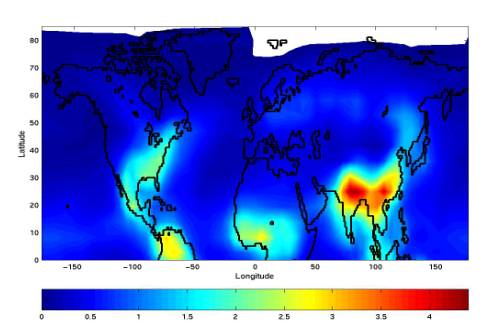
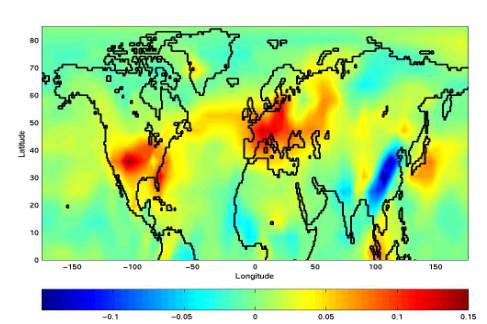
Figure 6: Left panel: Chemical net production of ozone integrated
from 450 hPa to 120 hPa. Right panel: Change in chemical net production
of ozone due to aircraft integrated over the same height region.
The unit in both panels is 1011 molecules/(s*cm2).
Also, the flux of reactive nitrogen (NOy=NO+NO2+NO3+N2O5+HNO4+ClONO2+BrONO2+HNO3) through the tropopause has been calculated for both runs (see Figure 7).
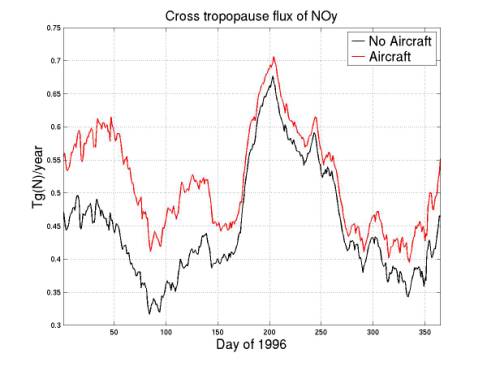
Figure 7: Cross tropopause flux of NOy.
Aircraft emissions increase the cross tropopause flux of NOy.
This effect is most pronounced (up to 20%) between January and
May when the tropopause height is relatively low at Northern mid
latitudes and, as a consequence, a greater fraction of aircraft
emissions occurs in the lower stratosphere rather than in the
upper troposphere.
Previous: Model validation Next: Summary and Future Plans Up: Ext. Abst.