Figure 1: Total ozone on 15 February 1996 observed from GOME (left panel) and calculated by CTM2 (right). [Dobson Units]
(note: the dark blue area east of the Caspian Sea seen in the
left panel is a region where no GOME data was available)
Previous: CTM2: Description of the model Next: Experiments Up: Ext. Abst.
3. Model validation
Total ozone
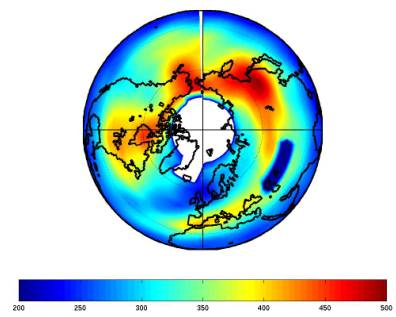
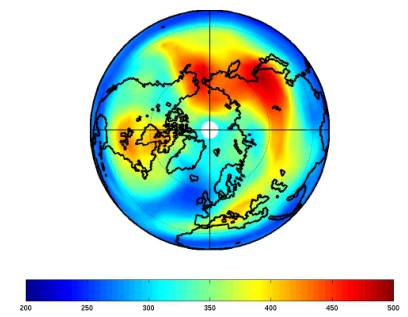
GOME data has been collected from the ATMOS User Center at http://auc.dfd.dlr.de and compared with results obtained from CTM2 runs. Figure 1 shows a comparison for 15 February 1996.
Figure 1: Total ozone on 15 February 1996 observed from GOME (left panel) and calculated by CTM2 (right). [Dobson Units]
(note: the dark blue area east of the Caspian Sea seen in the
left panel is a region where no GOME data was available)
When evaluating these results it has to be kept in mind that the uppermost layer of CTM2 contains only 2D data from the Oslo 2D model. Depending on latitude this layer is found to contribute between 15% (Poles) and 45% (low latitudes) to the total ozone column. Zonal variability of ozone occurring at altitudes above 20 hPa is not captured by CTM2, and yet, the agreement between CTM-2 and GOME is quite good, also in the Southern Hemisphere and during other seasons, for which no plots are shown here.
Vertical distribution of ozone
Height distributions of ozone were obtained by SAGE satellite observations and by LIDAR measurements at Andenes (Andøya, Northern Norway) for different heights and are compared with results from a CTM2 run. Figure 2 shows a comparison with SAGE data for 16 January 1996. The location of maxima agree well between model and observations. Also, the level agrees reasonably well with the exception of the 18 km altitude level where CTM2 overestimates the concentration of ozone by 50%.
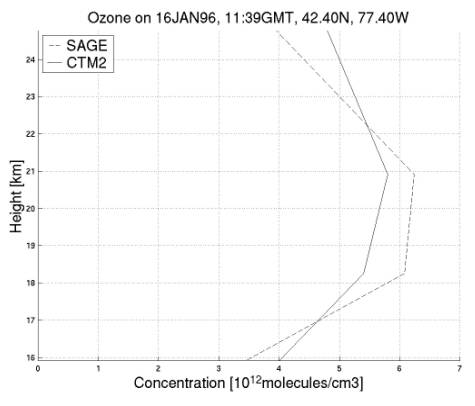
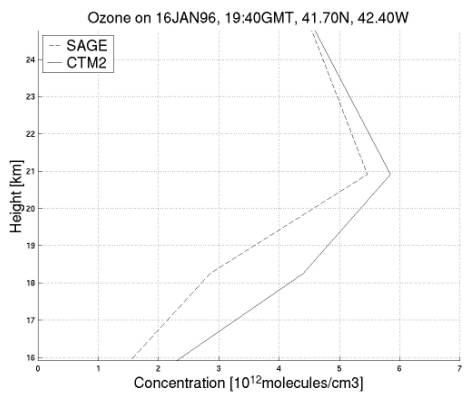
Figure 2: Comparison between SAGE satellite measurements of ozone with CTM2 data.
Figure 3 shows a time series plot for ozone at Andøya at two different altitudes. The level of ozone agrees well between observations and model. Deviations are assumed to be primarily due to the course horizontal resolution (T21). CTM2 nicely reproduces the high observed ozone levels at 25 km in the middle of March 1996 when Andøya was outside the Polar vortex, although the level is underestimated by about 15% in the beginning of this period.
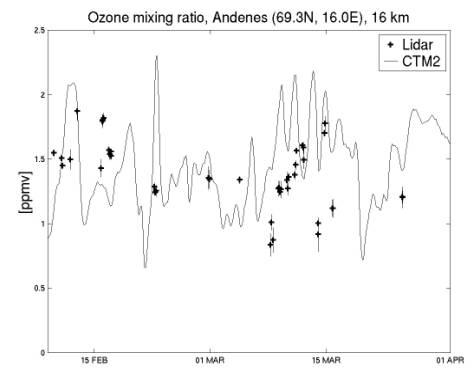
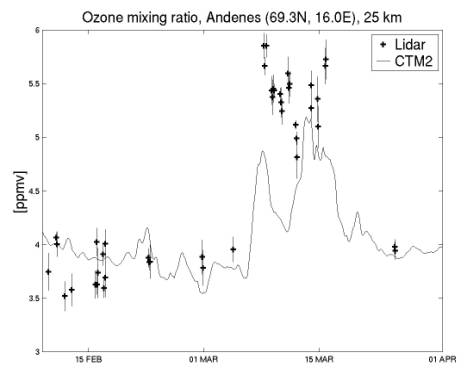
Figure 3: Comparison of ozone levels with LIDAR measurements at Andenes (Andøya, Northern Norway)
Previous: CTM2: Description of the model Next: Experiments Up: Ext. Abst.